Bitcoin Investing with an Edge
Bitcoin & Global Macro Charts
Indicator Alerts for critical timings
Exclusive On-chain Charts
Analysis Newsletters
Private Tradingview real-time charts
Cancel Anytime
MOST POPULAR |
|||
Free$ 0We respect your privacy: |
Advanced$ 24per month paid annually
|
Professional$ 99per month paid annually |
|
Market cycle charts resolutionSee what's happening right now |
24h |
Hourly
|
Hourly
|
Global Macro SuiteTrack the bigger picture influencing Bitcoin |
- | Essential Access | Complete Access |
Portfolio ToolsOn-chain Uncovered, Heatmaps, DCA tools |
- | Essential Access | Complete Access |
Max AlertsBe the first to know when charts hit key levels |
- | 40 Alerts | 100+ Alerts |
| - |
|
|
|
Insight ReportsLatest members-only insights for Bitcoin |
- | ||
Private TradingView IndicatorsView select charts in real-time |
- | 5 | 14 |
| - |
|
|
|
Downloadable Data CSVAccess accurate and reliable data |
- | - | |
API Access |
- | - | |
Advanced
$ 24
per month paid annually
- Yearly Save 30%
- Monthly
Institutional quality analytics. On-chain, Global Macro, Indicator Alerts, Real-time charting. Cancel anytime.
- Market cycle charts update: Hourly
- Macro Suite: Essential Access
- Portfolio Tools: Essential Access
- Instant Max Alerts:40
- Real-time Tradingview charts: 5
- Monthly reports: Yes
Professional
$ 99
per month paid annually
Full access to Macro Suite, Portfolio tools, Blockchain charts, real time indicators and downloadable data. The complete package for experienced analysts and investors, giving you everything you need.
- Market cycle charts update: Hourly
- Macro Suite: Complete Access
- Portfolio Tools: Complete Access
- Instant Max Alerts:+100
- Real-time Tradingview charts: 14
- Monthly reportsYes
- Downloadable CSV dataYes
- API AccessYes
Included in your membership…
Included in your membership…
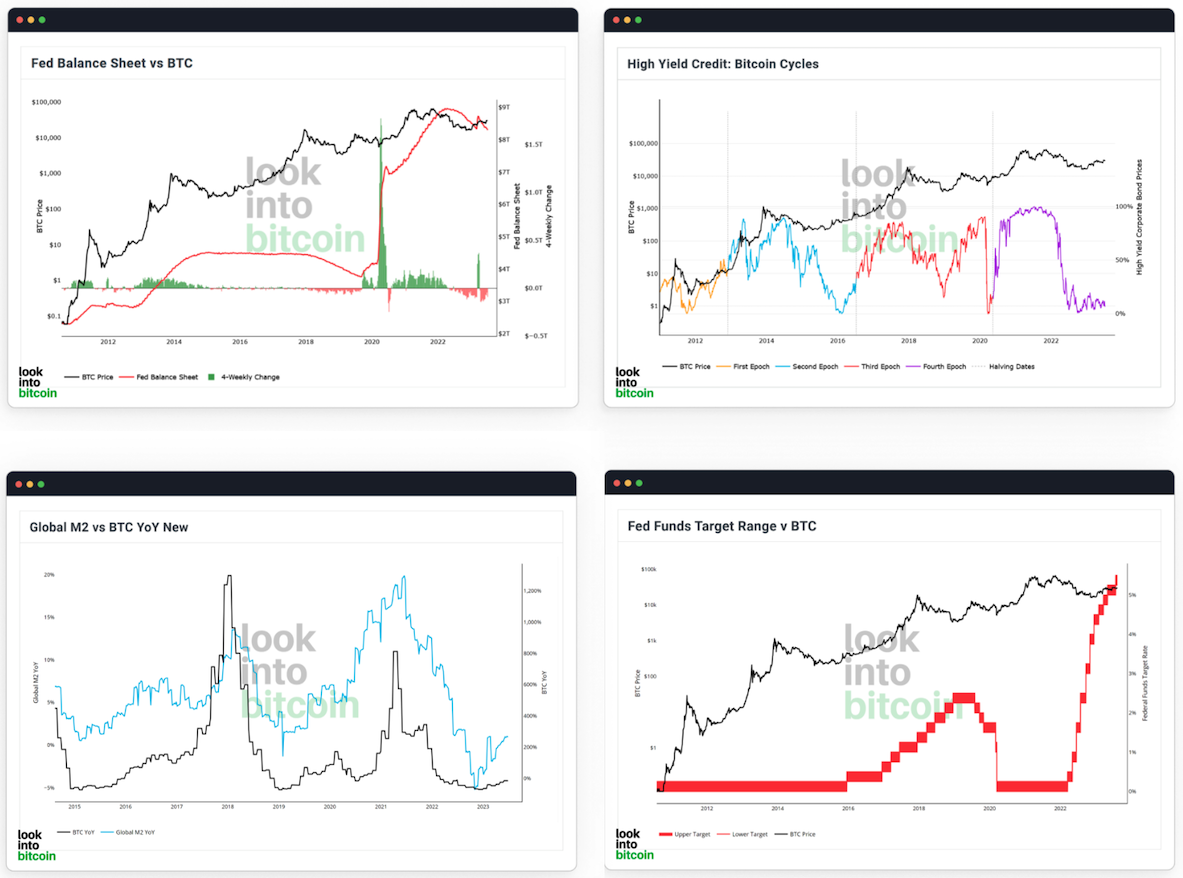
Global Macro and Bitcoin Charts
See what's really moving Bitcoin's price.
To understand Bitcoin you need to see the Global Macro charts that drive its price.
Access Macro Suite with its extensive library of Global Macro charts and full explainers of how they're influencing Bitcoin's price.
Be empowered and maximise your returns.
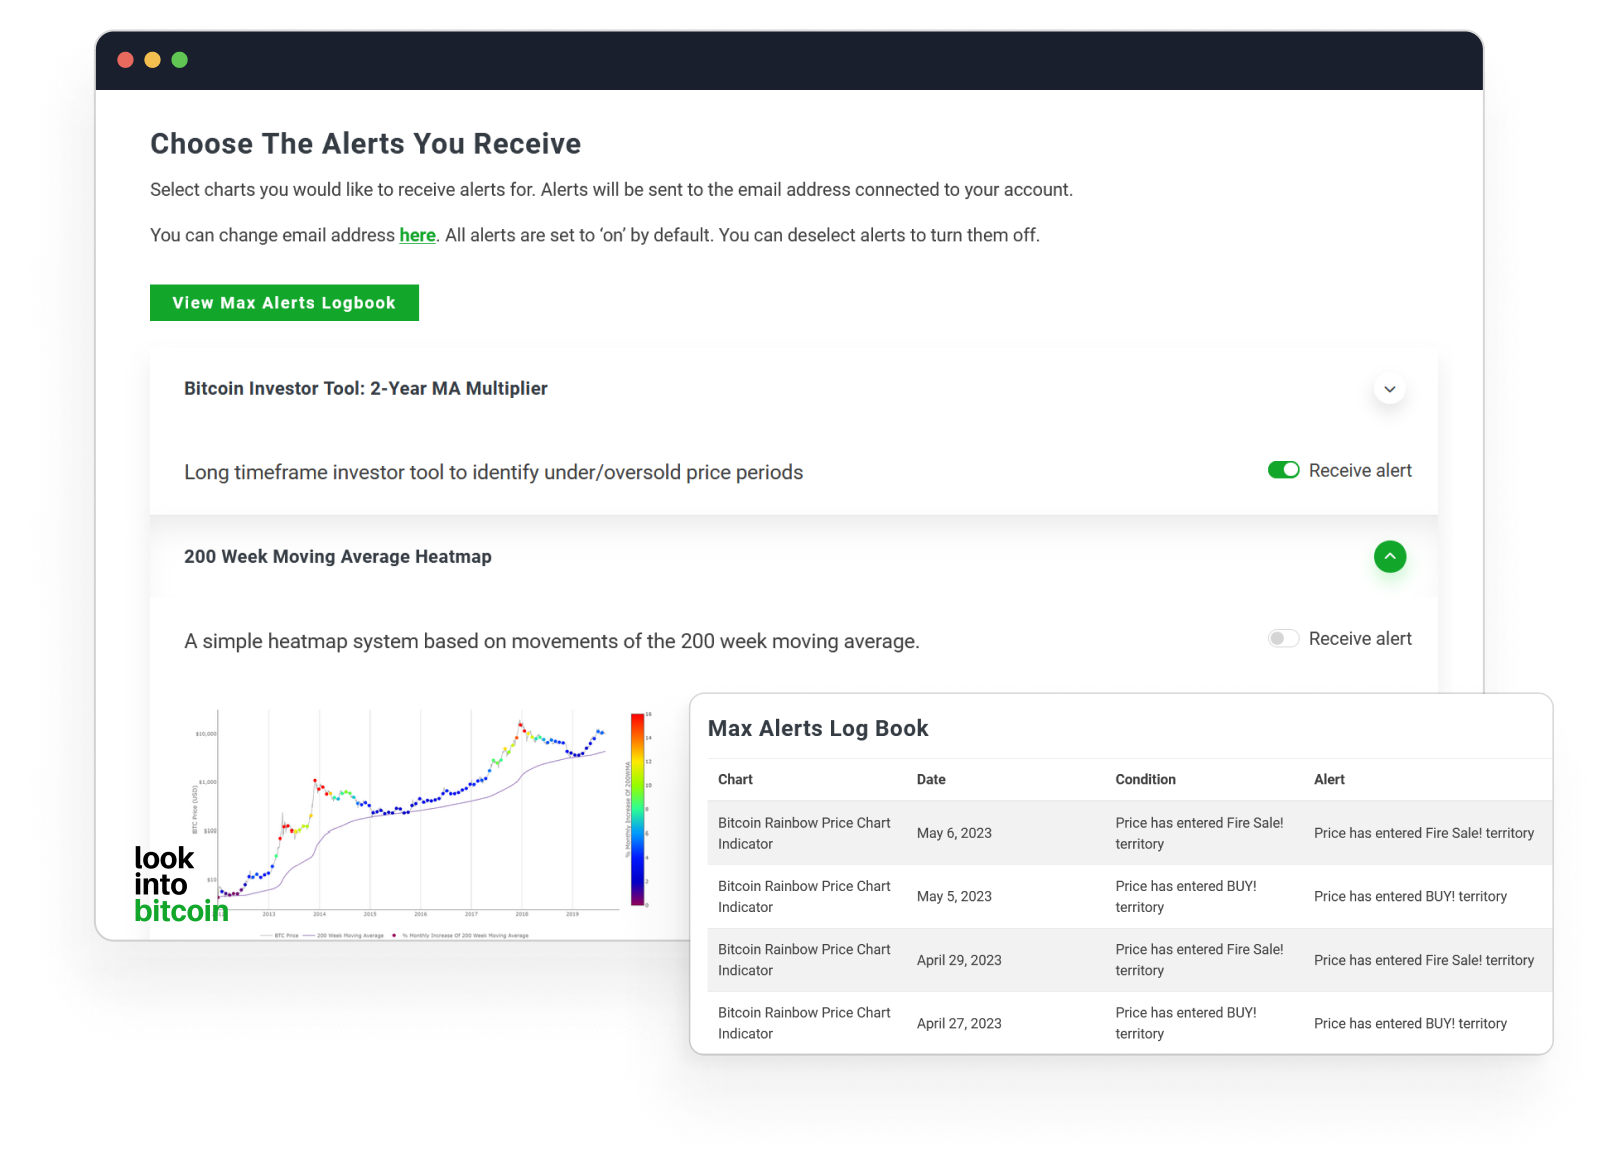
Max Alerts
Never miss critical levels on charts again.
Be the first to know when any of the following indicators hit key levels by receiving an exclusive email alert:
- Bitcoin Investor Tool: 2-Year MA Multiplier
- 200 Week Moving Average Heatmap
- Stock-to-Flow Model
- MVRV Z-Score
- The Golden Ratio Multiplier
- Pi Cycle Top Indicator
- The Puell Multiple
- Net Unrealized Profit/Loss (NUPL)
- AASI (Active Address Sentiment Indicator)
- RHODL Ratio
- Addresses with Balance > 1,000 BTC
- Fear And Greed Index
- Whale Shadows (aka Revived Supply)
- Hash Ribbons Indicator
- Bitcoin Rainbow Price Chart Indicator
- Advanced NVT Signal
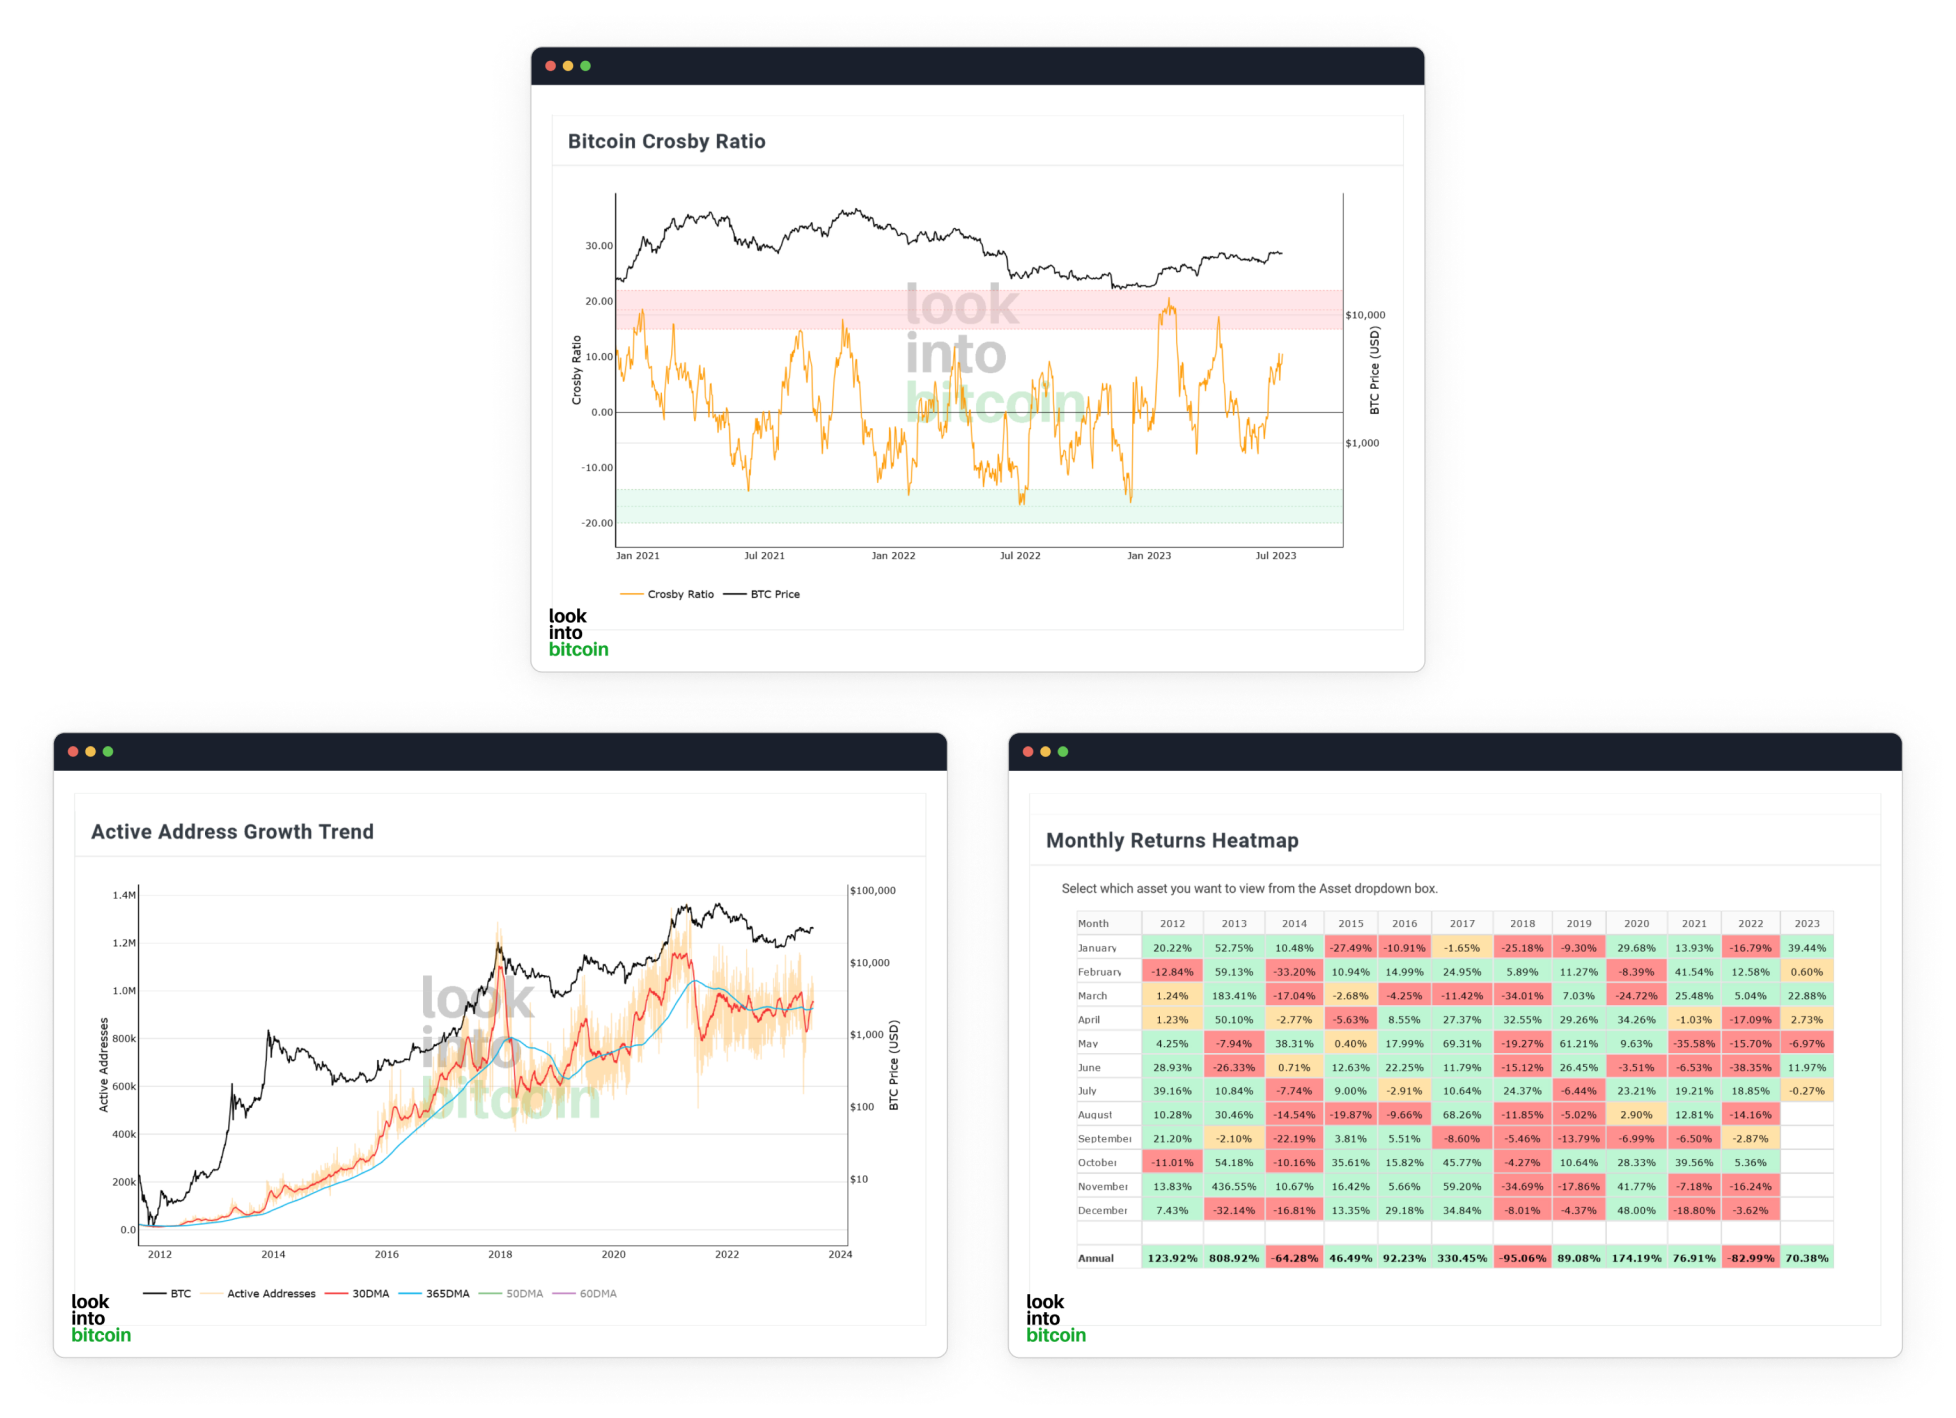
Portfolio Tools
Bitcoin tools you can't get anywhere else.
Access the most comprehensive charting dashboards for Bitcoin.
Heatmaps, dollar cost average tools, and our On-chain Uncovered series of charts.
Analysis Newsletter
Manage your emotions at market extremes.
Receive a monthly newsletter that has our analysis of the market.
The newsletters you will receive forecast where Bitcoin is in its market cycles, and where price may be moving next.
They contain analysis using critical Global Macro drivers, internal On-chain data, as well as trading analysis. So you can understand what is really going on with Bitcoin.

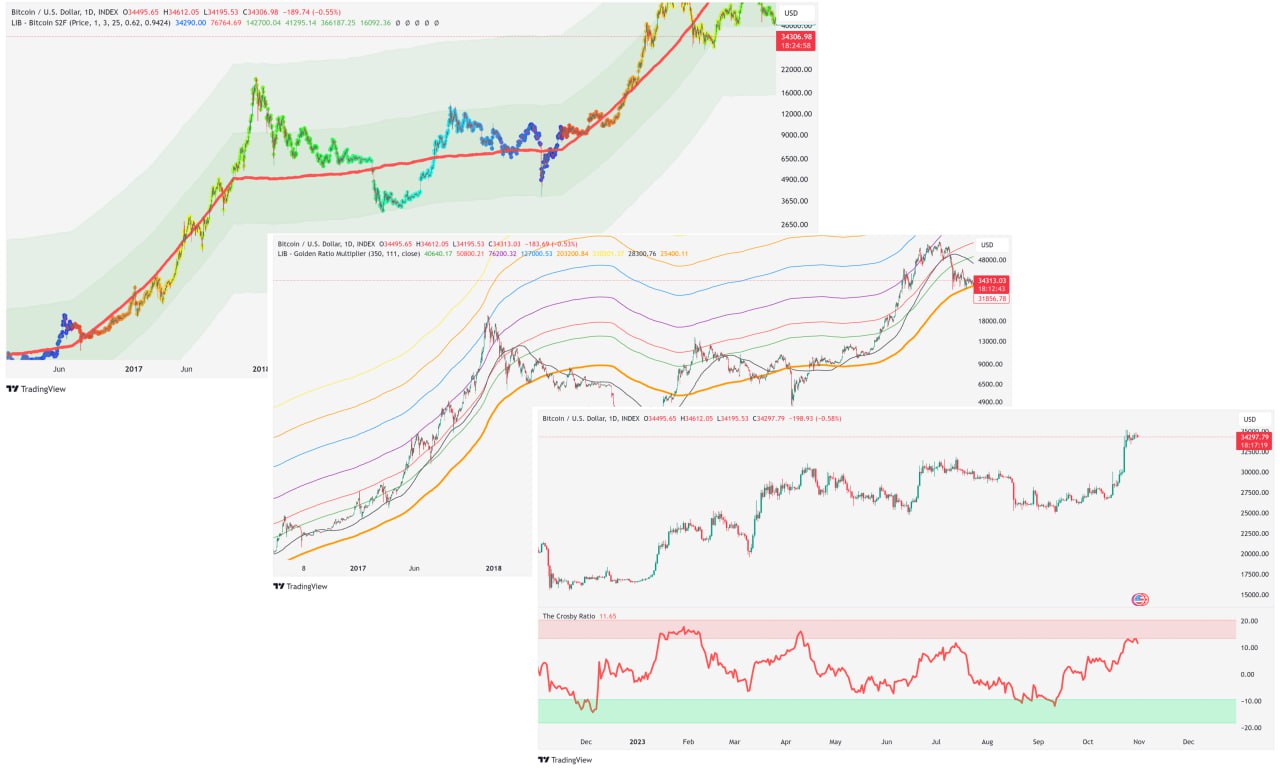
Private Tradingview Indicators
See key Bitcoin chart levels in real-time!
Receive access to private Tradingview indicators for charts from Look Into Bitcoin. Advanced Plan indicators currently available:
- Bitcoin Investor Tool
- Stock to Flow
- Golden Ratio Multiplier
- Pi Cycle Top Indicator
- Puell Multiple
Or get +14 private indicators on the Pro Plan
What Our Members Say

Got the Look Into Bitcoin Tradingview scripts already, Stock to flow is a great addition, thank you.
gradegradegradegradegradeMatt B.
Worth every penny. Easy to use with fast, high quality charts and tools combined with really clear and comprehensive analysis and explanations. I love being a Look into Bitcoin subscriber as they keep on adding more tools and upgrades. If you want to get smarter about Bitcoin you need to subscribe to Look into Bitcoin.
gradegradegradegradegradeMartin J.
Look Into bitcoin provides the best analysis in the industry. Awesome newsletter, always look forward to your rational and unbiased thesis.
gradegradegradegradegradeArmand W.
This is the only platform where I can see blockchain, macro, and global asset data in one place updating constantly. Incredible value for money.
gradegradegradegradegradeIzaac. R
The only place where I get a clear holistic view of Bitcoin. Other platforms provide piecemeal sections of information such as derivatives data or on-chain data but Look Into Bitcoin is the most comprehensive analytics platform available where I see everything easily in one place with stunning charts.
gradegradegradegradegradeAndrew P.
Look Into Bitcoin is my go-to for Bitcoin information. Bitcoin leads the crypto market, so if you know what's happening with it, you know where the rest of the market is going. There is now no better analytics than Look Into Bitcoin.
gradegradegradegradegradeCharles S.
Insightful and slick intuitive design makes Look Into Bitcoin amazing value for money. This upgrade for members makes it the leader in the analytics space. Combining all the portfolio tools and macro suite is pure Alpha. A must for any Bitcoin investor.
gradegradegradegradegradeDavid R.
Look Into Bitcoin is FIRE! I can't believe it took me this long to finally subscribe but there is so much value in it. Yes, there are a ton of onchain charts but it goes beyond just the 'here's onchain data' internal stuff and dives deep into the key global macro charts, long-term investment planning, alerts for all the key charts, and how to understand where Bitcoin price is going next. 'Totally worth it!' would be an understatement.
gradegradegradegradegradeJess C.
Discovering Look Into Bitcoin felt like uncovering the holy grail of cryptocurrency analysis, offering the depth of insight and clarity I had been searching for. Your comprehensive charts and analyses provided me with a newfound confidence in navigating the market, allowing me to make more educated decisions based on key indicators of overbought and oversold conditions.
gradegradegradegradegradeTed
Frequently Asked
Questions
1. What payment methods do you accept?
We accept all major debit cards and credit cards. Including Visa, Mastercard, American Express and UnionPay.
2. Can I cancel my account at any time?
Yes. If you cancel during your subscription period, you will continue to enjoy the membership features until the end of your subscription period. Please note, we do not issue refunds.
3. Do you offer any discounts?
Yes. If you choose the annual plan you get 30% off.
4. How do I change my plan after I sign up?
You can easily change your plan under Account Settings.
Get the complete picture
for your Bitcoin investing.
Faster charts. Macro Suite. Portfolio Tools. Max Alerts. Real time indicators.
Get StartedSave up to 75% with
Look Into Bitcoin