
 Bitcoin: Bitcoin Miner Difficulty
Zoom in with touchscreen: Touch and hold with ONE finger then drag.
Zoom in on desktop: Left click and drag.
Reset: Double click.
What Is This Chart Showing?
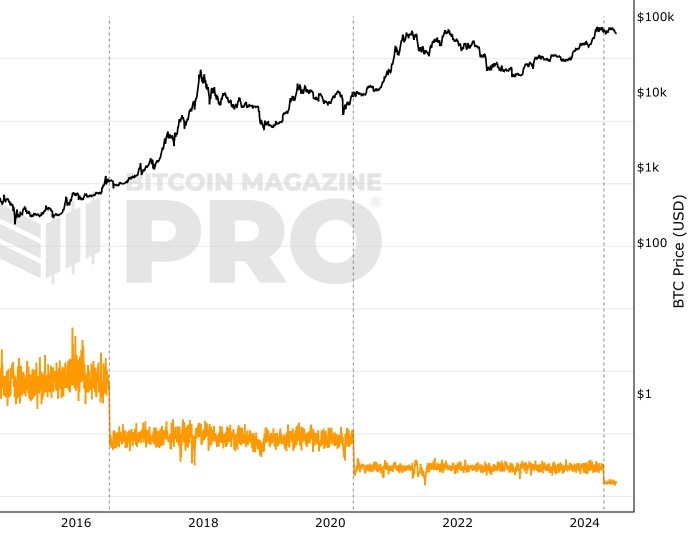
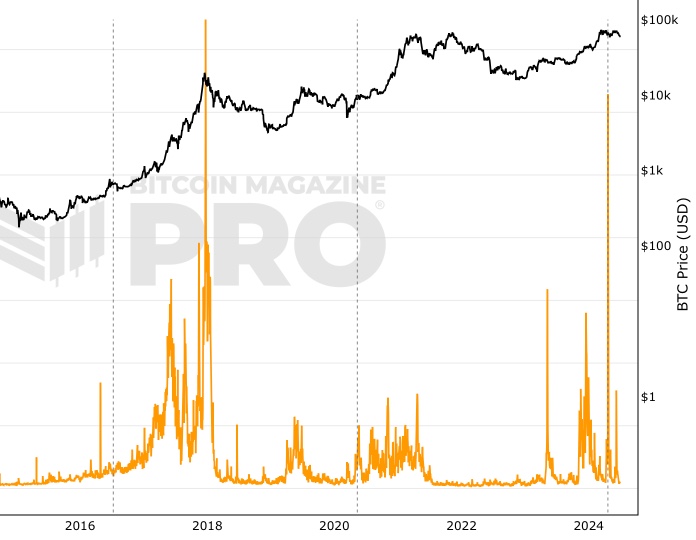
This Bitcoin live chart shows the increases and decreases in mining difficulty over time for bitcoin miners as they try to mine for new blocks.
Bitcoin difficulty is a statistical measurement that identifies how many hashes need to be generated to find a valid solution to solve the next Bitcoin block. Miners that are able to find the solution earn the mining reward.
Change in Bitcoin Mining Difficulty
The algorithm in the source code of Bitcoin is what actually controls the pace of change for mining difficulty, as there is no centralized owner of Bitcoin. Its calculations for difficulty change are dependent on the amount of competition in the network mining for new blocks.
The changes in mining difficulty ensure that new blocks are generally discovered steadily over time, approximately once every 10 minutes.
This steady mining of blocks ensures that the amount of bitcoin entering the network through mining is consistent over time, meaning that its inflation rate can be easily forecasted. To many, this is very appealing when compared to fiat currencies that can have their rate of supply manually adjusted by centralized entities.
You May Also Be Interested In
Miner Revenue (Block Rewards)
Bitcoin miner revenues earned from block rewards.

Hash Ribbons Indicator
Hash Ribbons Indicator: Highlights miner capitulation to identify major price lows.
Miner Revenue (Fees)
Bitcoin miner revenues earned from fees.
Make smarter decisions about Bitcoin. Instantly.
Access the Bitcoin and Global Macro Charts that really drive Bitcoin’s price.
+40 chart alerts. Never miss critical levels on charts again.
Analysis newsletter. Manage your emotions at market extremes.
Private Tradingview indicators. See Bitcoin chart levels in real time!
Cancel anytime.
Any information on this site is not to be considered as financial advice. Please review the Disclaimer section for more information.