
 Bitcoin: Realized Price
Zoom in with touchscreen: Touch and hold with ONE finger then drag.
Zoom in on desktop: Left click and drag.
Reset: Double click.
What is Realized Price?
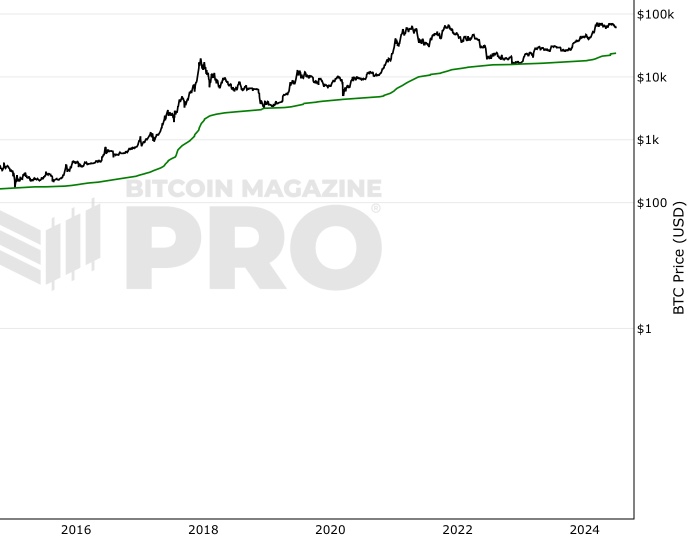
Bitcoin Realized Price is the value of all bitcoins at the price they were last transacted on-chain, divided by the number of bitcoins in circulation. This gives us the ‘average cost basis’ at which all bitcoins were purchased, which is another way of describing Realized Price.
So unlike the current Market Price, which tells us the price of $BTC right now, Realized Price tells us the average purchase price of all bitcoins in circulation.
Finally, to be technically correct and also explain an assumption in the above statements, Realized Price values each UTXO not on its current value, but on the value when it last moved from one wallet to another. We are assuming that movement from one wallet to another wallet is bitcoins being ‘bought’.
How Is It Different To Realized Cap?
Realized Capitalization (Realized Cap) is a metric used to compare against Market Capitalization (Market Cap) rather than Market Price.
Market Cap is market price multiplied by the number of coins in circulation.
You can see Realized Cap on the MVRV Z-Score chart.
Why Is It Important?
Bitcoin Realized Price is important because it shows the economic state of the Bitcoin market at an overall level.
When the $BTC Market Price is ABOVE Realized Price then, on aggregate, the market participants are in profit.
When the $BTC Market Price is BELOW Realized Price then, on aggregate, the market participants are incurring a paper loss.
How Is Realized Price Useful For Bitcoin Investors?
It is a useful metric because it can show when the market is under a period of distress. That is when the current Market Price drops below Realized Price, meaning that on aggregate Bitcoin holders are holding onto paper losses.
Historically, these periods have occurred at major cycle lows. This can be seen on the free Bitcoin live chart above.
The reason why this phenomenon happens is that many participants are not comfortable holding onto a losing position, fearing that their losses may increase. Particularly in a bear market when news and media about Bitcoin are very negative. They end up selling to value investors at the market cycle lows before $BTC Market Price eventually moves back up above Realized Price as it enters a bull market phase. This has historically held true as Bitcoin has continued to move through its adoption cycle.
Fall Further Down The Rabbit Hole
Realized Price is an adaptation of Realized Cap which was first originally created by Antoine Le Calvez in 2018.
Similar Live Charts That You May Find Useful
Charts on this site that use the ‘Realized Value’ approach include NUPL, RHODL Ratio, and MVRV Z-Score.
You May Also Be Interested In
CVDD
Pricing model for identifying Bitcoin bear market lows.
Net Unrealized Profit/Loss (NUPL)
On-chain indicator for investor sentiment market stages
Advanced NVT Signal
This adaptation of NVT Signal adds standard deviation bands to identify when Bitcoin is overbought or oversold.
Make smarter decisions about Bitcoin. Instantly.
Access the Bitcoin and Global Macro Charts that really drive Bitcoin’s price.
+40 chart alerts. Never miss critical levels on charts again.
Analysis newsletter. Manage your emotions at market extremes.
Private Tradingview indicators. See Bitcoin chart levels in real time!
Cancel anytime.
Any information on this site is not to be considered as financial advice. Please review the Disclaimer section for more information.