
 Bitcoin: Terminal Price
Zoom in with touchscreen: Touch and hold with ONE finger then drag.
Zoom in on desktop: Left click and drag.
Reset: Double click.
Indicator Overview
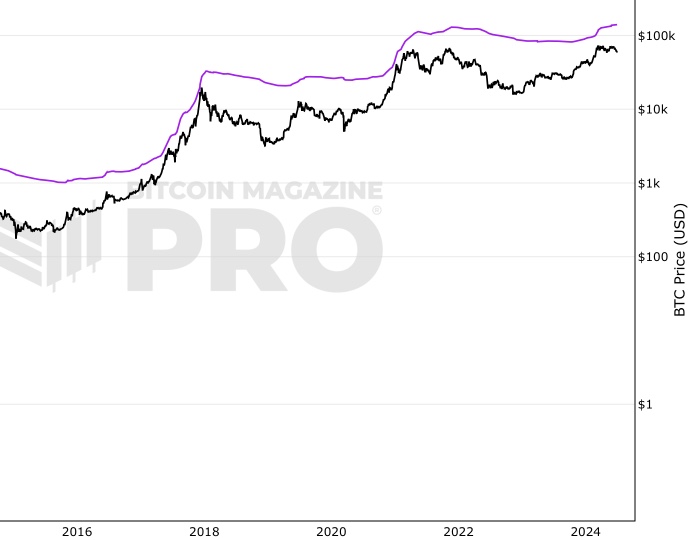
Before Terminal price is calculated, it is first necessary to calculate Transferred Price. Transferred price takes the sum of Coin Days Destroyed and divides it by the existing supply of bitcoin and the time it has been in circulation. The value of Transferred Price is then multiplied by 21. Remember that there can only ever be 21 million bitcoin mined.
This creates a 'terminal' value as the supply is all mined, a kind of reverse supply adjustment. Instead of heavily weighting later behavior, it normalizes historical behavior to today. By normalizing by 21, a terminal value is created.
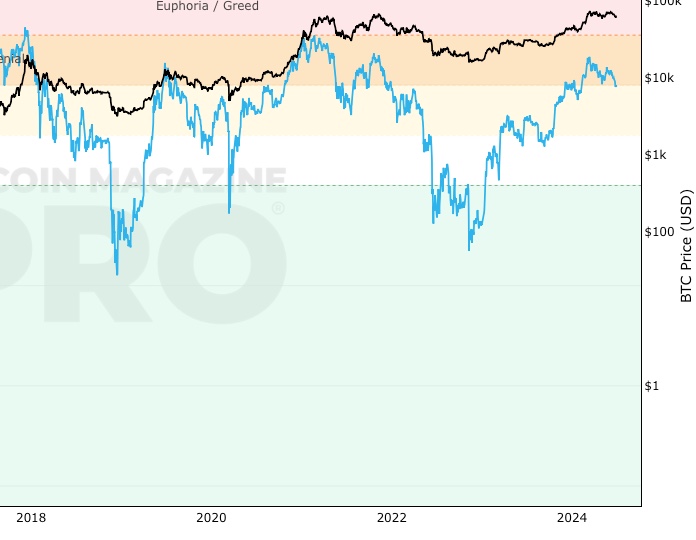
This Terminal Price has historically been very effective at forecasting the tops of Bitcoin price cycles.
How It Can Be Used
This Terminal Price has historically been very effective at forecasting the tops of Bitcoin price cycles. It can be used alongside other similar tools found on the Price Forecast Tools page.
Fall Further Down The Rabbit Hole
Terminal Price was created by @_checkmatey_.
You May Also Be Interested In
Delta Top
Pricing model for identifying Bitcoin bull market highs.
Net Unrealized Profit/Loss (NUPL)
On-chain indicator for investor sentiment market stages
AASI (Active Address Sentiment Indicator)
Comparing change in price with change in number of addresses to determine if Bitcoin is over/undervalued in the short term.
Make smarter decisions about Bitcoin. Instantly.
Access the Bitcoin and Global Macro Charts that really drive Bitcoin’s price.
+40 chart alerts. Never miss critical levels on charts again.
Analysis newsletter. Manage your emotions at market extremes.
Private Tradingview indicators. See Bitcoin chart levels in real time!
Cancel anytime.
Any information on this site is not to be considered as financial advice. Please review the Disclaimer section for more information.