 Bitcoin: Spent Output Profit Ratio (SOPR)
Zoom in with touchscreen: Touch and hold with ONE finger then drag.
Zoom in on desktop: Left click and drag.
Reset: Double click.
What is SOPR?
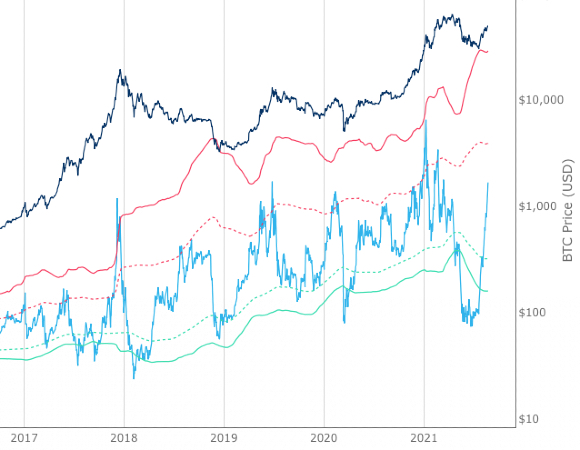
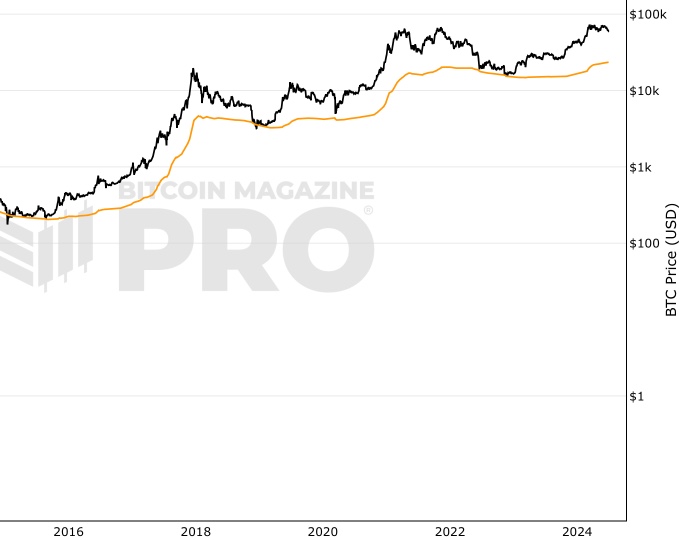
Spent Output Profit Ratio (SOPR) tracks the profit level of all moved bitcoins during a given period. It indicates whether sellers are in profit or loss when their transaction takes place on the blockchain.
Note, there is an assumption that when coins move they are being sold. This is not always the case as an individual could be moving them from one address to another address they own.
For this metric, we assume anyone moving coins on-chain is a ‘seller’. While not perfect it is a reasonable proxy when aggregated to show whether coins are moving at a ‘profit’ or a ‘loss’ during the allocated period.
How is SOPR calculated?
Spent Output Profit Ratio (SOPR) looks at the ratio between the US Dollar value when the UTXO was created and the US Dollar value when the UTXO is spent.
A UTXO is an Unspent Transaction Output, it refers to the balance in a bitcoin address.
By conducting on-chain analysis, we can observe whether outgoing transactions from a wallet are in profit or loss. Aggregating this data within a specific timeframe allows us to generate the data that goes into visualizing the Spent Output Profit Ratio (SOPR) chart above.
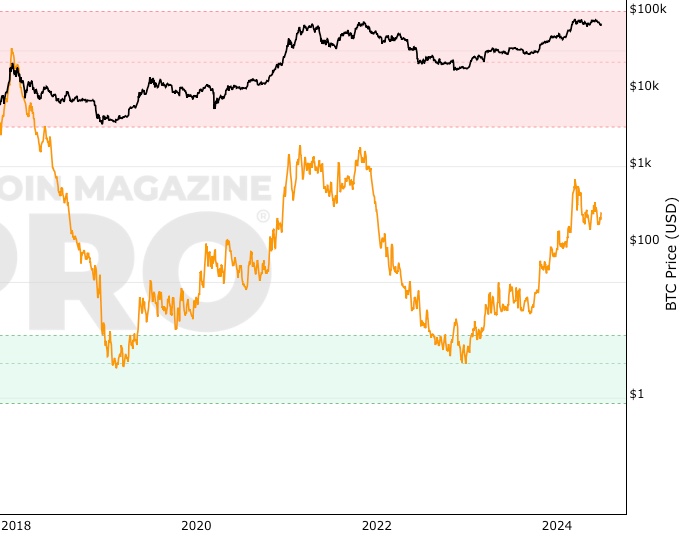
SOPR above 0 = coins moved between wallets during that period are in profit overall.
SOPR below 0 = coins moved between wallets during that period are ‘being sold’ at a loss.
SOPR trending up = suggests an increasing level of realized profits over the time period where the upward trend is being noted.
SOPR trending down = suggests a fall in realized profits over the time period where the downtrend is being noted.
Why is SOPR useful?
Spent Output Profit Ratio (SOPR) is useful because it provides a snapshot of actual market participant behavior during a specific period. It can therefore act as a useful market sentiment tool.
If significant losses are realized (i.e. SOPR is negative) and those losses increase over time, then that tells us that market participants are fearful and expect the price of Bitcoin to drop further.
In Bitcoin bull markets, such periods can be opportunistic times to buy for the astute investor, depending on other supporting data points.
Who Created SOPR?
Spent Output Profit Ratio (SOPR) was first created by Renato Shirakashi. You can follow him on Twitter here: @renato_shira
You May Also Be Interested In
Advanced NVT Signal
This adaptation of NVT Signal adds standard deviation bands to identify when Bitcoin is overbought or oversold.
Balanced Price
Pricing model for identifying Bitcoin bear market lows.
RHODL Ratio
On Chain Indicator using Realized HODL Ratio’s to identify cycle high price tops.
Make smarter decisions about Bitcoin. Instantly.
Access the Bitcoin and Global Macro Charts that really drive Bitcoin’s price.
+40 chart alerts. Never miss critical levels on charts again.
Analysis newsletter. Manage your emotions at market extremes.
Private Tradingview indicators. See Bitcoin chart levels in real time!
Cancel anytime.
Any information on this site is not to be considered as financial advice. Please review the Disclaimer section for more information.