
 Bitcoin: Bitcoin Rainbow Price Chart Indicator
Zoom in with touchscreen: Touch and hold with ONE finger then drag.
Zoom in on desktop: Left click and drag.
Reset: Double click.
Key Takeaways
- This chart is the most up-to-date version of the Rainbow chart available online, with a calculation from October 2023. Price updates every day.
- This version of the Bitcoin Rainbow chart is a mathematically calculated logarithmic growth curve. It does not just use upper and lower historical price line fitting.
- People use the charts Rainbow colored bands to determine whether Bitcoin price is currently under or overvalued.
- The Rainbow chart is a meme chart. It is not investment advice!
What Is The Bitcoin Rainbow Chart Indicator?
The Rainbow price chart is a long-term valuation tool for Bitcoin. It uses a logarithmic growth curve to forecast the potential future price direction of Bitcoin.
It overlays rainbow color bands on top of the logarithmic growth curve channel to highlight market sentiment at each rainbow color stage as Bitcoin price moves through it. Therefore indicating potential opportunities for the Bitcoin investor using the chart.
Is the Bitcoin Rainbow chart accurate?
Yes, it is a correct calculation of a logarithmic growth curve and captures historical long-term price movements within a channel formed around the log growth curve.
However, that does not mean that Bitcoin price has to continue to follow that same channel in the future.
Despite this, many people are watching this chart to see if it continues to follow it over time as Bitcoin price moves into a new market cycle.
How is the Bitcoin rainbow chart constructed?
This is the most up-to-date version of the BTC Rainbow chart available on the internet.
It was generated in October 2023 so uses recent price data as well as historical data. This is the latest Bitcoin Rainbow Chart 2023.
As a result, it offers the most accurate outlook for the Bitcoin Rainbow Chart and $BTC price moving through it.
The previous version of the live Bitcoin rainbow chart can be found here.
How to Interpret The Rainbow Chart
Because Bitcoin is still a relatively young asset class, its price movements are highly volatile. Over time as Bitcoin is adopted, there is a general upward price movement but within that trend, there are volatile market cycles.
During the market cycles, the price of Bitcoin can increase parabolically and also drop very quickly.
The live BTC rainbow chart highlights where BTC price is in those cycles and provides a viewpoint on investor strategy.
Warmer upper colors of the rainbow chart show when the market is likely overheated. Such periods have historically proven to be good times for the strategic investor to begin taking some profits.
Cooler colors indicate periods where overall market sentiment is typically depressed and many investors become uninterested in Bitcoin. The Rainbow chart highlights that these periods are typically excellent times for the strategic investor to accumulate more Bitcoin.
This live Bitcoin Rainbow chart updates every 24 hours with the latest daily close price live, and will always be available to view on this page for free. Look Into Bitcoin subscribers can also view the chart close to real-time on hourly timeframes.
Important points to remember about the Bitcoin Rainbow Chart and investing
- It uses historical price data as its input to project the direction of the rainbow bands.
- It does not use any blockchain data to try and identify what different market participants are doing in the Bitcoin ecosystem.
- It is a meme chart, meant to be used for fun and not taken too seriously.
- As with all charts and information on this site, it is not investment advice.
Fall Further Down The Rabbit Hole
The first example of a logarithmic regression curve for Bitcoin was created by Bitcoin Talk user trolololo. This is the original chart, which shows how $BTC price could potentially evolve over time using log growth regression analysis:
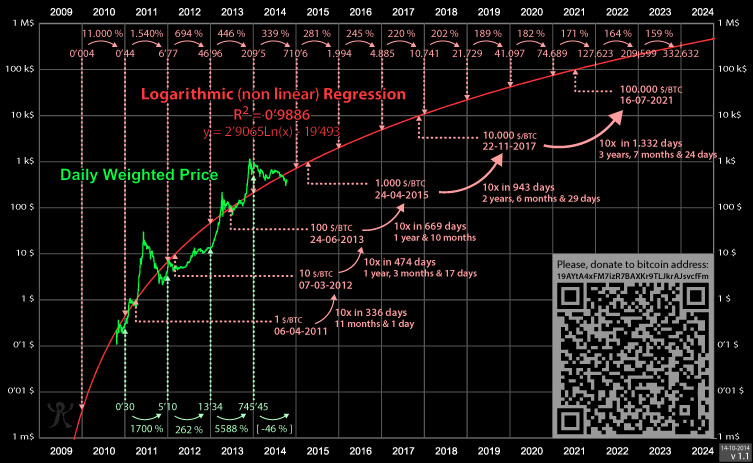
You can check out this link if you would like to view the original discussions and idea-sharing around the Bitcoin logarithmic growth channel that initially took place back in 2014 when the price of 1 Bitcoin was just $385.
You can also view a standard logarithmic chart growth curve on the Logarithmic Growth Curve Live Chart page for Bitcoin.
Video Explainer
You May Also Be Interested In
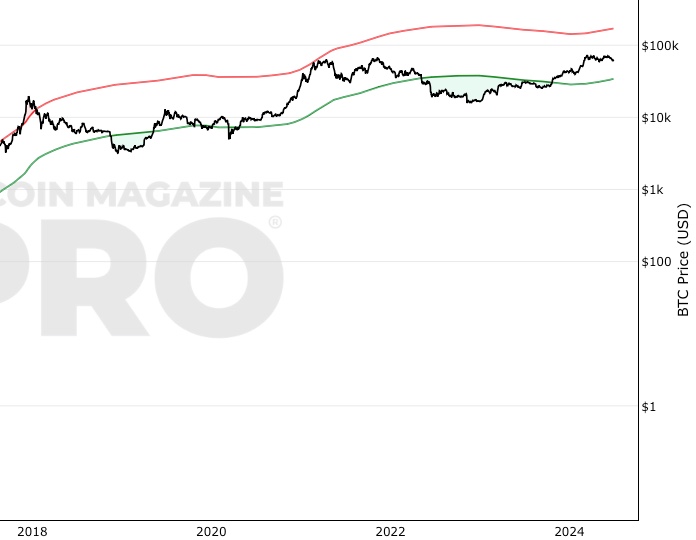
Bitcoin Investor Tool: 2-Year MA Multiplier
Long timeframe investor tool to identify under/oversold price periods
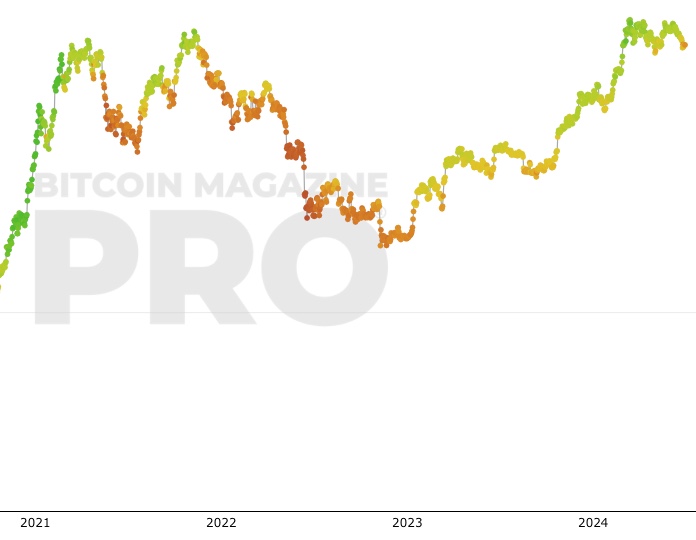
Fear And Greed Index
Market sentiment tool gauging investor fear and greed over time.
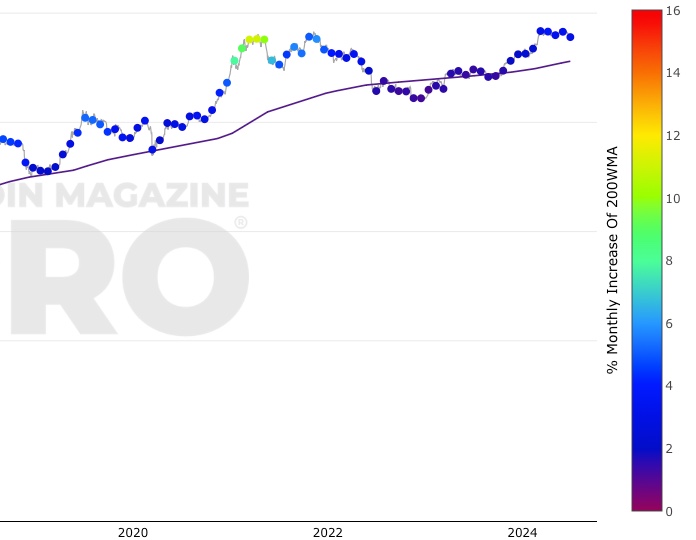
200 Week Moving Average Heatmap
A simple heatmap system based on movements of the 200 week moving average.
Make smarter decisions about Bitcoin. Instantly.
Access the Bitcoin and Global Macro Charts that really drive Bitcoin’s price.
+40 chart alerts. Never miss critical levels on charts again.
Analysis newsletter. Manage your emotions at market extremes.
Private Tradingview indicators. See Bitcoin chart levels in real time!
Cancel anytime.
Any information on this site is not to be considered as financial advice. Please review the Disclaimer section for more information.