 Bitcoin: MVRV Quantile Bands
Zoom in with touchscreen: Touch and hold with ONE finger then drag.
Zoom in on desktop: Left click and drag.
Reset: Double click.
Need this data in your product? API licensing →
What Are MVRV Quantile Bands?
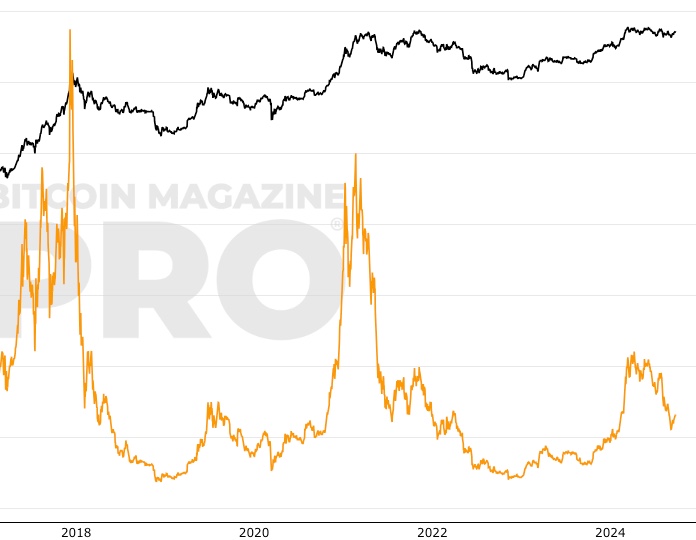
MVRV Quantile Bands show where Bitcoin's current price sits within its entire valuation history. The model takes the MVRV ratio, the relationship between Bitcoin's market price and its Realized Price (the average price at which every coin last moved), and ranks today's reading against every day that came before it. The result is drawn directly onto the price chart as twenty shaded valuation bands, each representing 5% of all historical readings.
When price trades in the green bands at the bottom of the range, Bitcoin is cheaper than it has been for the vast majority of its history. These are the zones where disciplined accumulation has historically been rewarded. When price climbs into the red bands at the top, it is trading at valuations reached on only a small fraction of all days, territory associated with cycle tops and long-term holder distribution.
How Are the Bands Calculated?
A well-known problem with raw MVRV analysis is that its extremes shrink every cycle. The ratio peaked near 8 in 2011, near 6 in 2013, under 5 in 2017, and under 4 in 2021. A threshold that marked the top in one cycle may never be reached in the next. MVRV Quantile Bands are built to account for this contraction:
- The MVRV ratio is calculated for every day of Bitcoin's trading history.
- A declining line is fitted through confirmed cycle peaks, and a rising line through confirmed cycle troughs. Together they form a contracting envelope that captures how each cycle's extremes compress.
- Each day's MVRV reading is normalized to its position inside that envelope, making 2013, 2017, 2021, and today directly comparable.
- The normalized readings are ranked into quantiles using the full history available up to each day, so the model never looks ahead.
- The quantile thresholds are translated back into price levels, producing the bands you see on the chart.
The shaded stack covers the 5th to the 95th percentile. Price is expected to break out of the bands at genuine extremes: every major cycle top has pushed above the 95th percentile band, and every major bear market low has dipped below the 5th.
How to Read the Chart
The main panel shows Bitcoin's price on a logarithmic scale over the valuation bands, alongside the Realized Price. The lower panel distills the same information into a single oscillator: the percentile of the current cycle-adjusted MVRV reading, from 0 (the cheapest conditions in Bitcoin's history) to 100 (the most expensive).
- Below the 25th percentile: price is historically cheap relative to Bitcoin's aggregate cost basis. Previous visits to this zone include the 2015, 2018-19, and 2022 bear market floors.
- Middle percentiles: fair value territory, where Bitcoin spends roughly half of its time and trend, rather than valuation, tends to dominate.
- Above the 75th percentile: valuations are stretched. Readings above 90 have historically clustered within months of major cycle peaks.
Because the model works in percentiles rather than fixed levels, it answers a simple question at any moment: how often has Bitcoin ever been cheaper, or more expensive, than it is right now?
MVRV Quantile Bands vs MVRV Z-Score
The MVRV Z-Score measures how far market value has deviated from realized value in standard deviations, and remains one of the most reliable tools for identifying cycle extremes. MVRV Quantile Bands approach the same underlying data from a different angle. Instead of asking how unusual today's deviation is, they ask what proportion of Bitcoin's entire history has traded at a richer or cheaper valuation, after adjusting for the well-documented contraction in MVRV's peaks and troughs across cycles.
The two charts are complementary. The Z-Score excels at flagging the extremes themselves, while the Quantile Bands give every day a precise rank, map that rank onto the price chart as actionable levels, and adapt automatically as the market matures. Watching them together provides a fuller picture of where Bitcoin sits in its valuation cycle.
Frequently Asked Questions
What is a good MVRV Quantile reading to accumulate Bitcoin?
Historically, readings below the 25th percentile have coincided with bear market accumulation ranges, and readings below the 10th percentile have appeared only near major cycle lows. No single metric guarantees a bottom, but the lower the percentile, the cheaper Bitcoin is relative to its own history.
Why do the valuation bands tighten over time?
As Bitcoin matures, its valuation extremes compress: each cycle's MVRV peak has been lower than the last, and each trough higher. The model fits this contraction directly, so the bands narrow in step with the market instead of relying on thresholds from a younger, more volatile era.
Can Bitcoin's price move outside the bands?
Yes, and that is by design. The shaded bands cover the 5th to 95th percentile of history. Breaks above the top band have marked the final phase of bull markets, and breaks below the bottom band have marked capitulation lows.
How is this different from the raw MVRV ratio?
The raw ratio tells you market value relative to realized value today, but the same number can mean different things in different cycles. The quantile approach converts each reading into a percentile of all history, adjusted for cycle compression, making readings comparable across every era of Bitcoin's existence.
Can I access MVRV Quantile Bands data via API?
Yes. The full daily dataset, including every band level and the percentile reading, is available through our API for all API subscribers.
This chart is provided for informational purposes only and is not investment advice.
You May Also Be Interested In

Percent Addresses in Loss
The Percentage of Bitcoin Addresses in Loss
Short Term Holder MVRV Z-Score
MVRV Z-Score focussing on short-term investors.

Short Term Holder MVRV
MVRV focussing on short-term investors.
Make smarter decisions about Bitcoin. Instantly.
Access the Bitcoin and Global Macro Charts that really drive Bitcoin’s price.
+40 chart alerts. Never miss critical levels on charts again.
Analysis newsletter. Manage your emotions at market extremes.
Private Tradingview indicators. See Bitcoin chart levels in real time!
Cancel anytime.
Any information on this site is not to be considered as financial advice. Please review the Disclaimer section for more information.