
 Bitcoin: Hash Ribbons Indicator
Zoom in with touchscreen: Touch and hold with ONE finger then drag.
Zoom in on desktop: Left click and drag.
Reset: Double click.
What is the Hash Ribbons Indicator?
The Bitcoin Hash Ribbon indicator tries to identify periods where Bitcoin miners are in distress and may be capitulating. The assumption is that such periods can occur when the price of $BTC is at major lows, and may therefore present a good opportunity to buy the dip.
The role of miners is to secure the Bitcoin network and to process every Bitcoin transaction. There can be periods after the price of bitcoin rallied and then aggressively pulled back that some miners struggle to financially continue in the short term. When this happens they turn off their mining rigs.
As the author of this indicator Charles Edwards states in his article Hash Ribbons & Bitcoin Bottoms, “When miners give up, it is possibly the most powerful Bitcoin buy signal ever”.
This indicator does not try to time the perfect bottom in price. Rather it shows periods where Bitcoin mining rigs are being turned off due to the challenging market conditions, causing drops in hash rates. These can often be areas of macro bottoms in Bitcoin price.
For a strategic long-term Bitcoin investor, these periods can be favorable times to accumulate Bitcoin and therefore present a buying opportunity.
How Is This Bitcoin Chart Calculated?
Bitcoin Difficulty is adjusted approximately once every two weeks, or once every 2016 blocks to be precise. A block is typically processed on the Bitcoin blockchain once every 10 minutes.
However, hash rate is calculated on a daily basis, so gives us a sense of miner activity (health) without as much time lag versus the Bitcoin Difficulty adjustments.
The Hash Ribbons indicator bitcoin uses simple daily moving averages (DMA’s) to identify when hash rate is in a heavy downtrend. It also uses them to identify when hash rate is starting to pull out of downtrends, which can be very useful for the strategic Bitcoin investor.
The Hash Ribbon chart indicates that mass miner capitulation has typically ended when the 30-day moving average (30DMA) of Bitcoin hash rate crosses back above the 60-day moving average (60DMA) after having fallen below it.
How to Interpret The Hash Ribbons Bitcoin Chart
30DMA dropping below 60DMA: hash rate declines and miners capitulating = Dark pink vertical lines
30DMA moving back above 60DMA: highlights miner capitulation ending = Light pink vertical lines
30DMA moving back above 60DMA AND price increasing = Return to white. Effectively a hash ribbon buy signal according to this indicator.
The transition from green vertical lines back to white on the chart indicates an opportunity for the long-term strategic investor. It is showing us that miners have capitulated and $BTC price is beginning to trend upwards once more.
The Hash Ribbons live chart shown above shows $BTC price action alongside hash ribbons. It is free to use and will continue to update every day.
Fall Further Down The Rabbit Hole
The Hash Ribbon was created by Charles Edwards. For more information read his article on Bitcoin Hash Ribbons.
You May Also Be Interested In
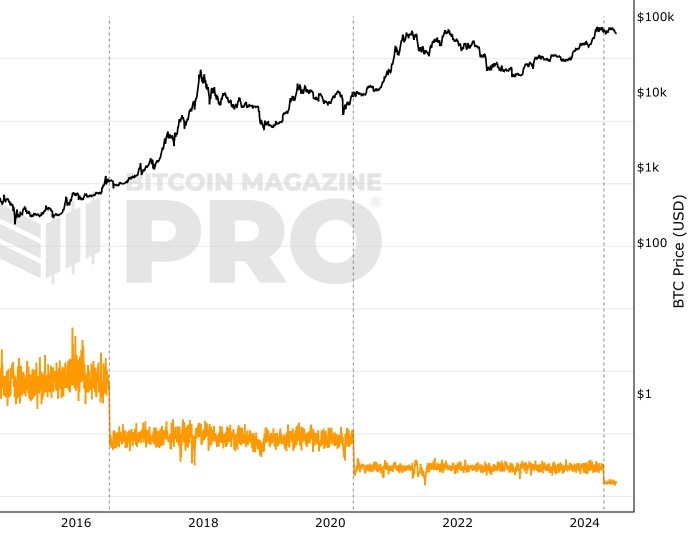
Miner Revenue (Block Rewards)
Bitcoin miner revenues earned from block rewards.
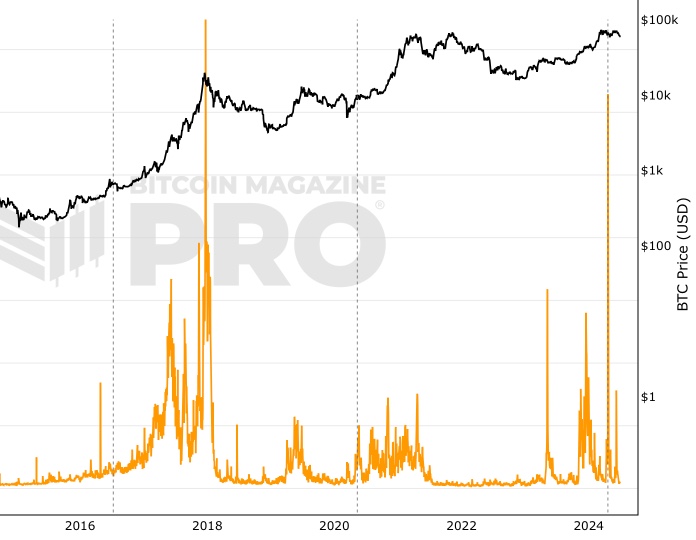
Miner Revenue (Fees)
Bitcoin miner revenues earned from fees.
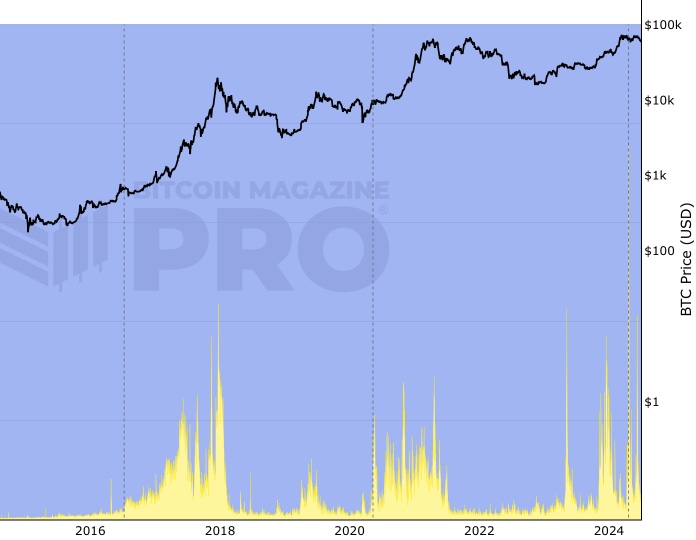
Miner Revenue (Fees vs Rewards)
Percentage comparison of Bitcoin miner revenues earned from fees and mining rewards.
Make smarter decisions about Bitcoin. Instantly.
Access the Bitcoin and Global Macro Charts that really drive Bitcoin’s price.
+40 chart alerts. Never miss critical levels on charts again.
Analysis newsletter. Manage your emotions at market extremes.
Private Tradingview indicators. See Bitcoin chart levels in real time!
Cancel anytime.
Any information on this site is not to be considered as financial advice. Please review the Disclaimer section for more information.