

Bitcoin: Addresses with Balance > 1 BTC
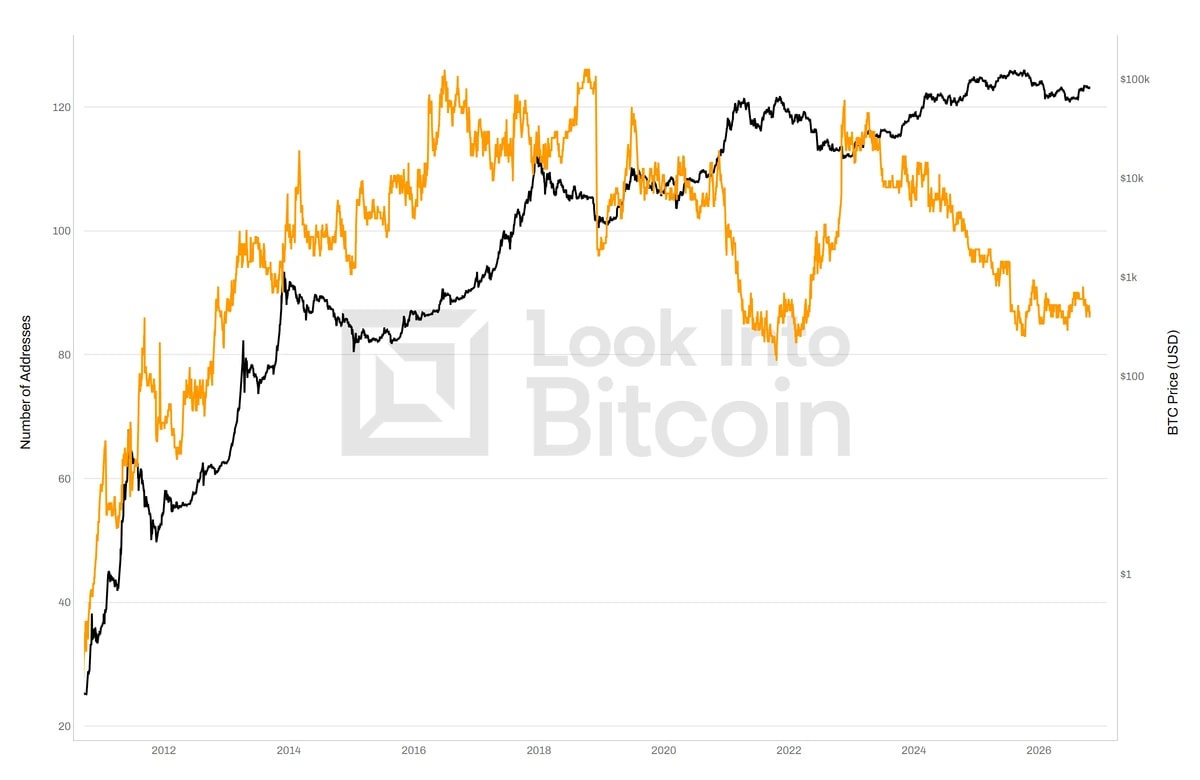
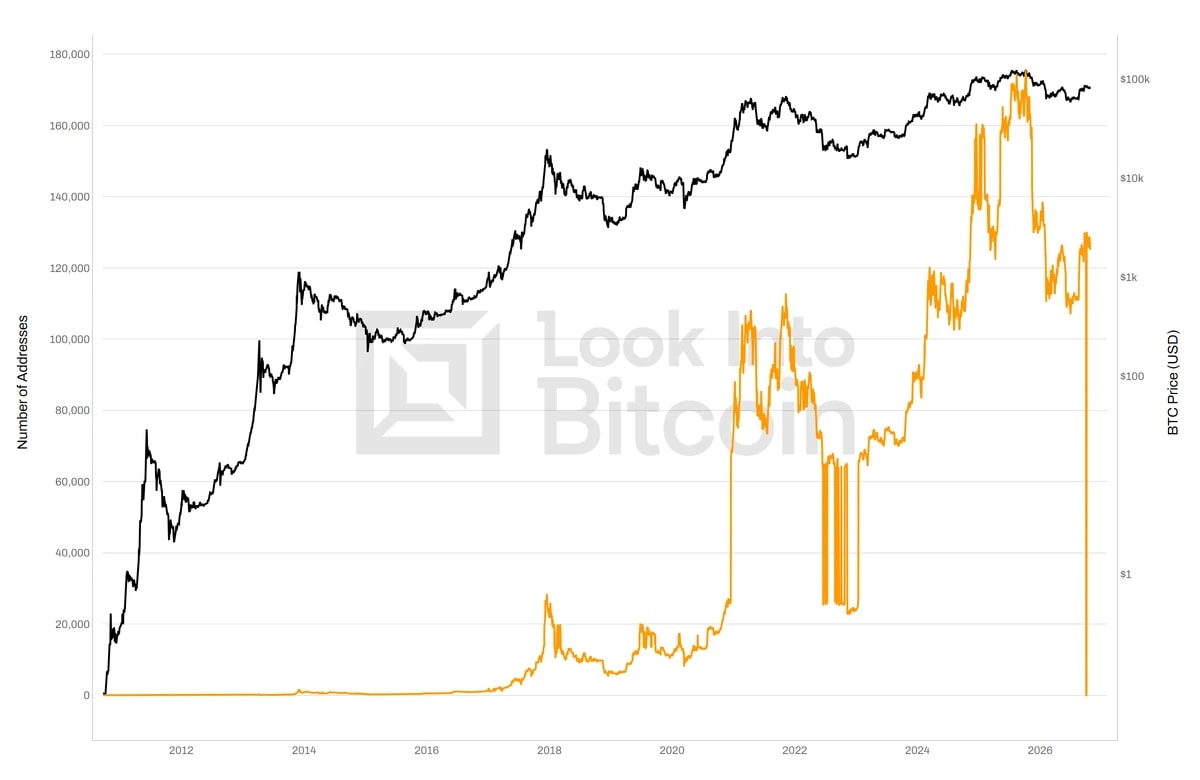
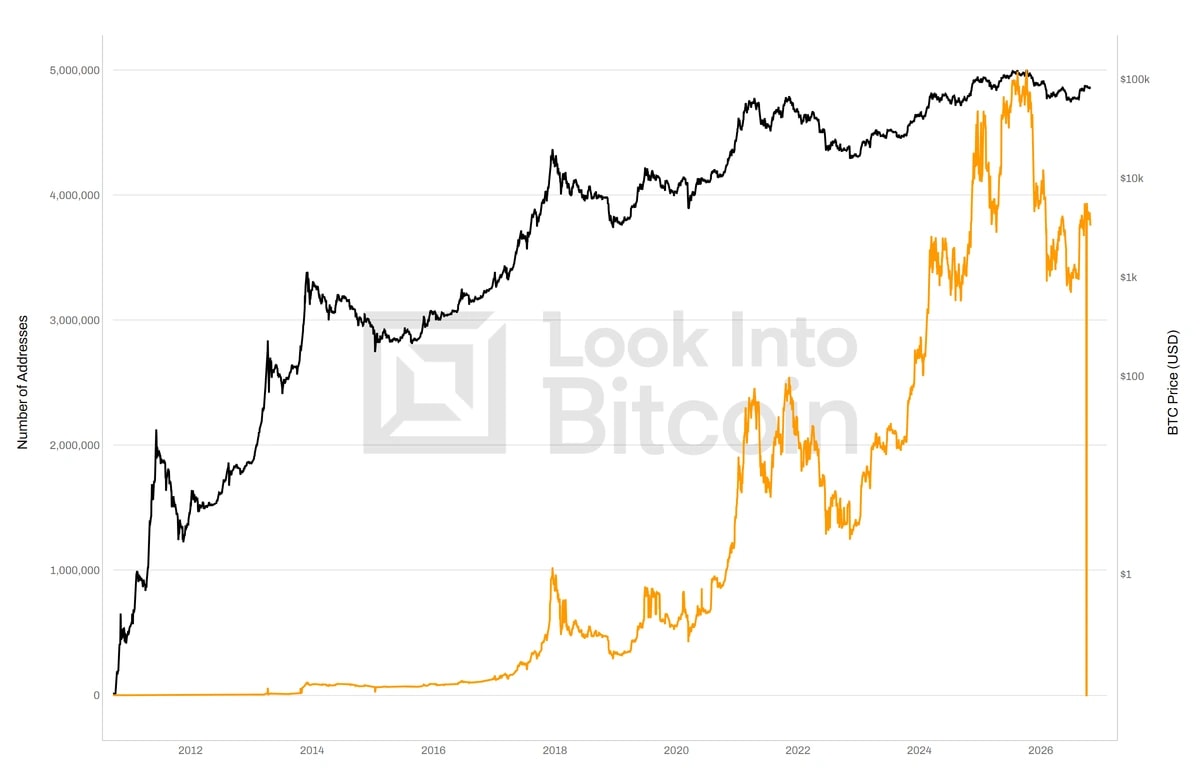
Number of unique Bitcoin addresses holding > 1 BTC
Need this data in your product? API Access →
About Bitcoin: Addresses with Balance > 1 BTC
You may also be interested in
Any information on this site is not to be considered as financial advice. Please review the Disclaimer section for more information.
Bitcoin: Addresses with Balance > 1 BTC
Number of unique Bitcoin addresses holding > 1 BTC
Need this data in your product? API Access →
About Bitcoin: Addresses with Balance > 1 BTC
You may also be interested in
1M+ monthly readers · 200+ member charts · 10+ yrs through cycles
You've read the chart. Now see everything it connects to.
Chart alerts
Know the moment a zone changes.
Private TradingView indicators
Your levels and signals live on your own charts, in real time.
Top Strategies
Five rules-based strategies built from our metrics. Every trade since 2019, vs. buy & hold and DCA. Hypothetical backtests.
Weekly expert reports
Weekly reports from founder Philip Swift and research director Matt Crosby on where we really are in the cycle.

AI Analyst
AI Analyst
Summary
Unlock the full analysis
AI Analyst explains what each chart means and what to watch next. Ask it anything about Bitcoin and get a straight answer.
YouTube