Live Price
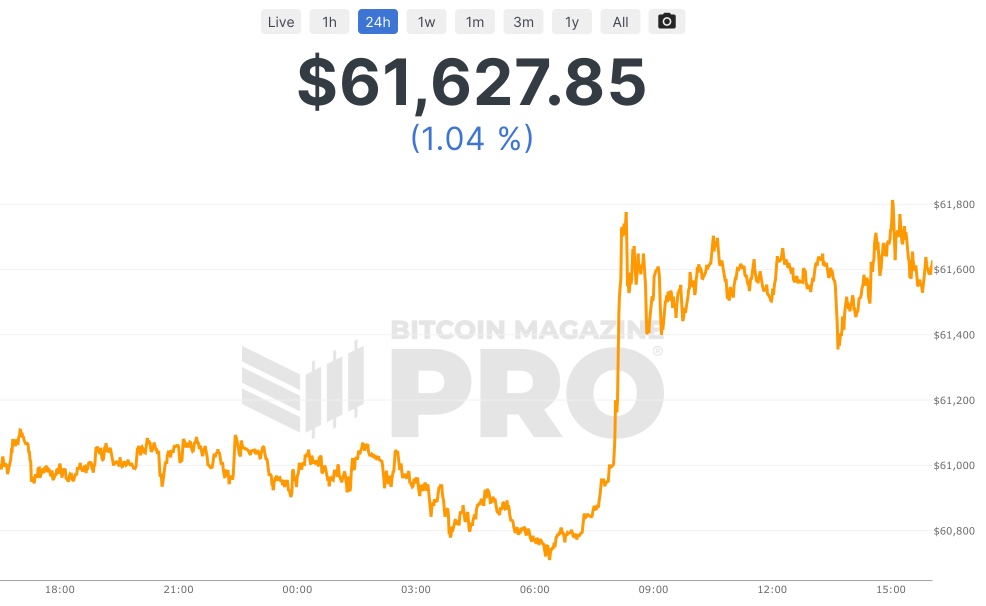
Bitcoin Price LiveNew
Live streaming of Bitcoin price with other price information.
Market Cycle Charts
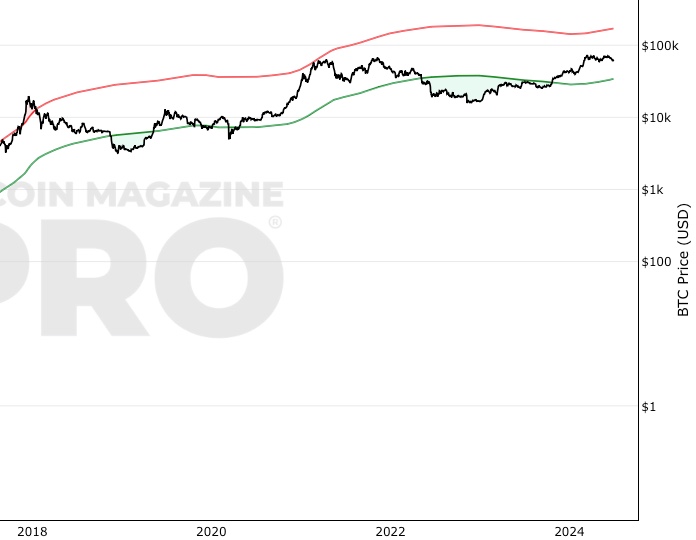
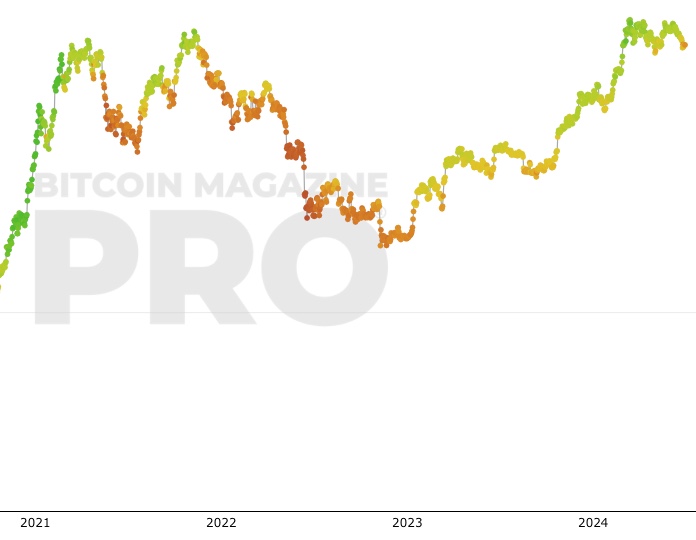
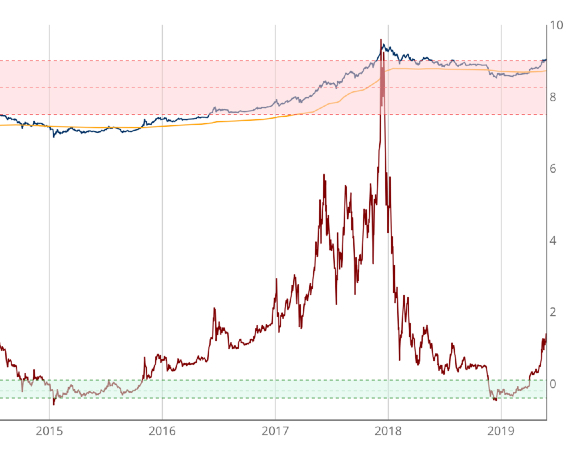
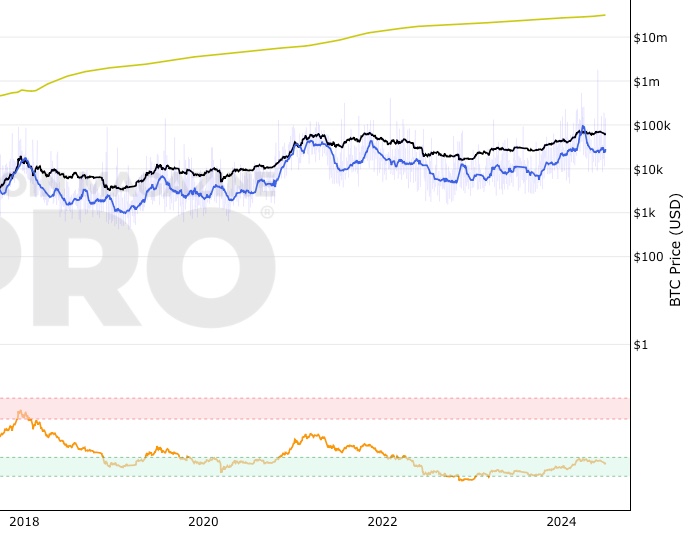
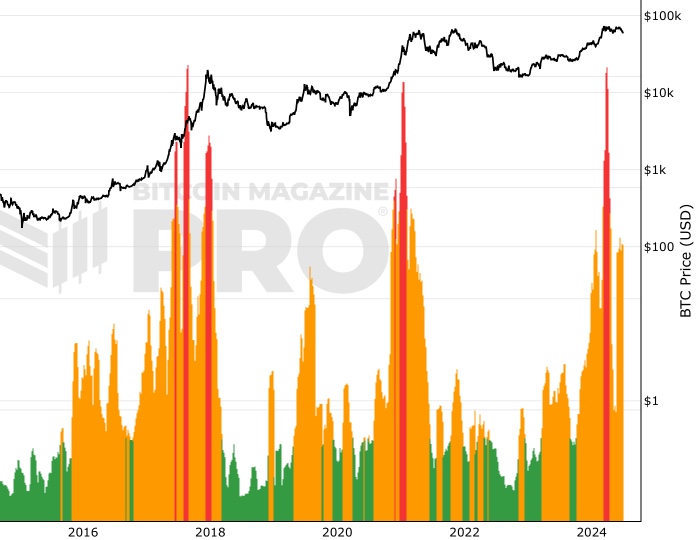
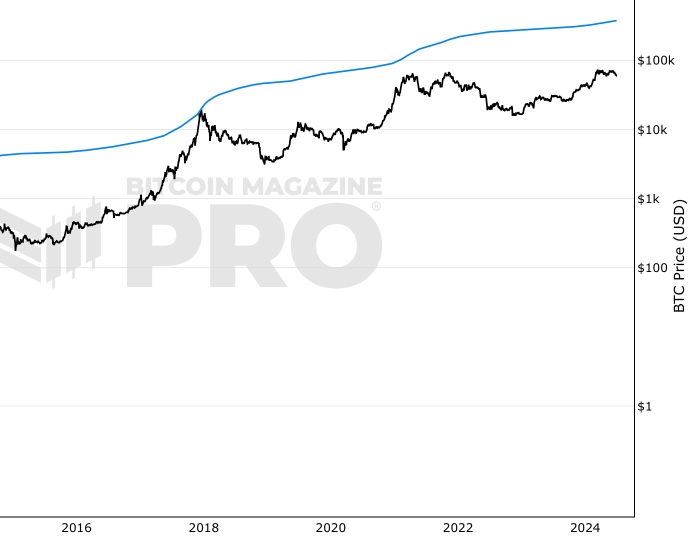
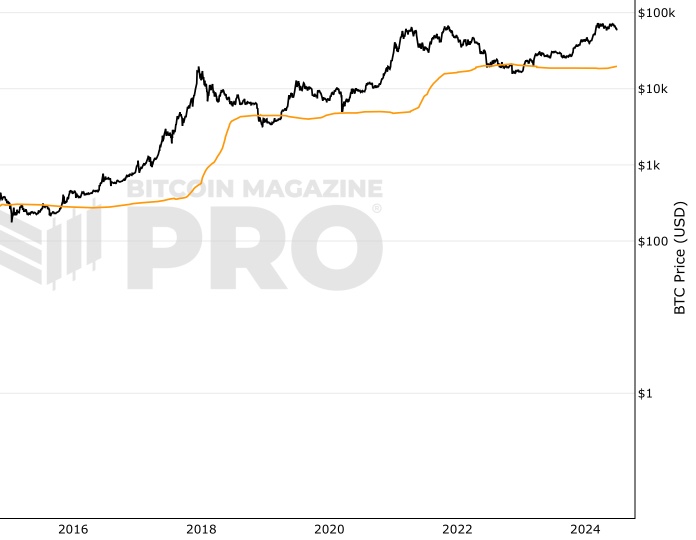
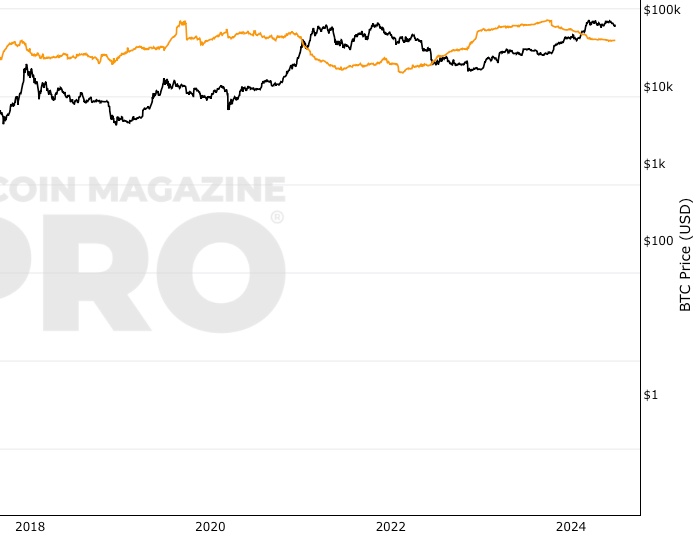
Bitcoin Investor Tool: 2-Year MA Multiplier
Long timeframe investor tool to identify under/oversold price periods
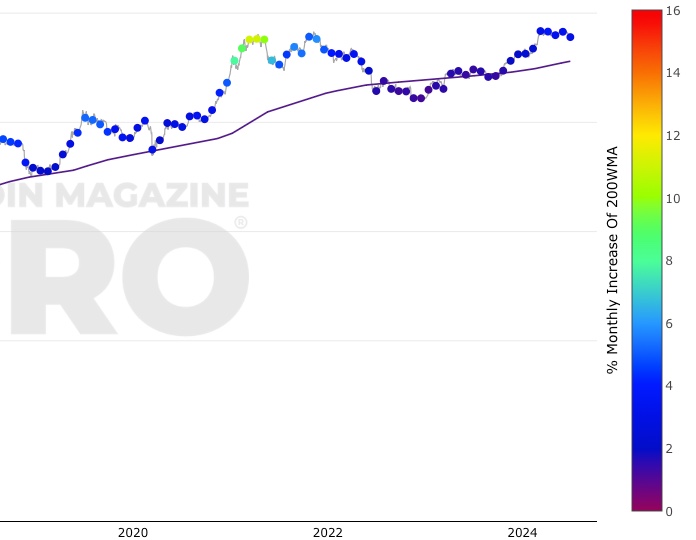
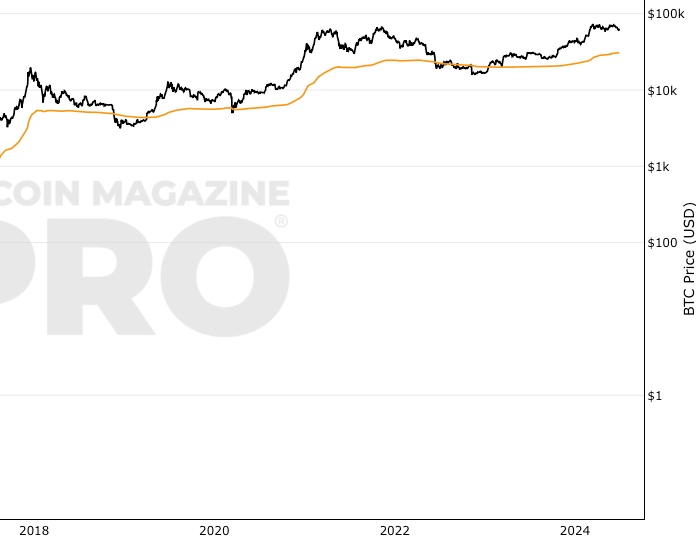
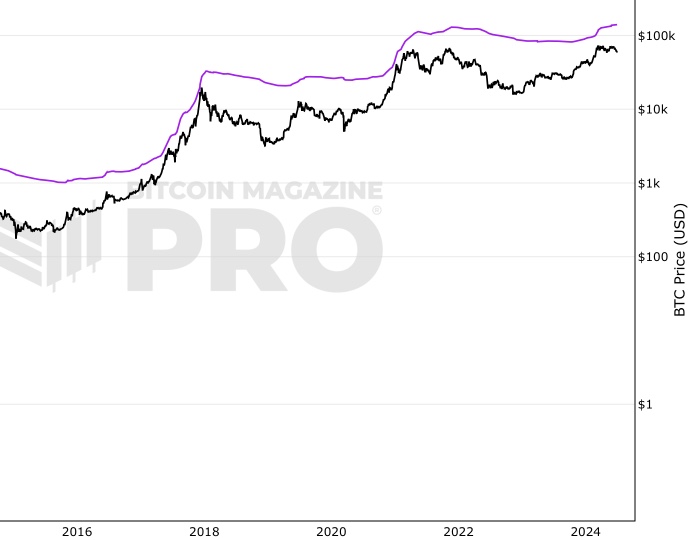
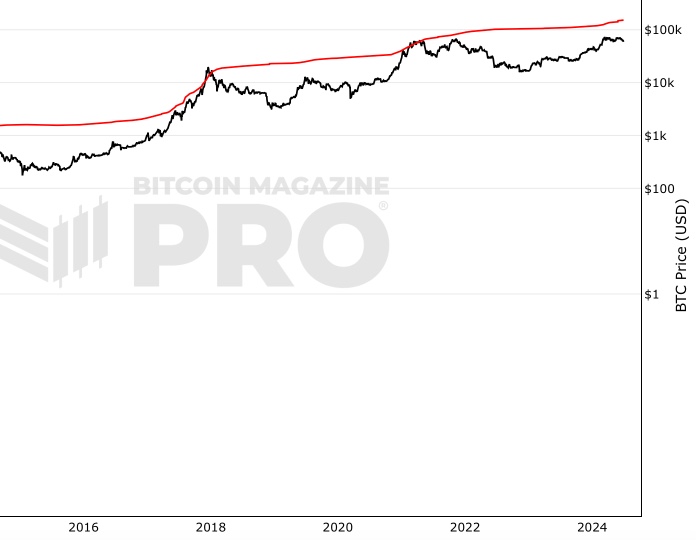
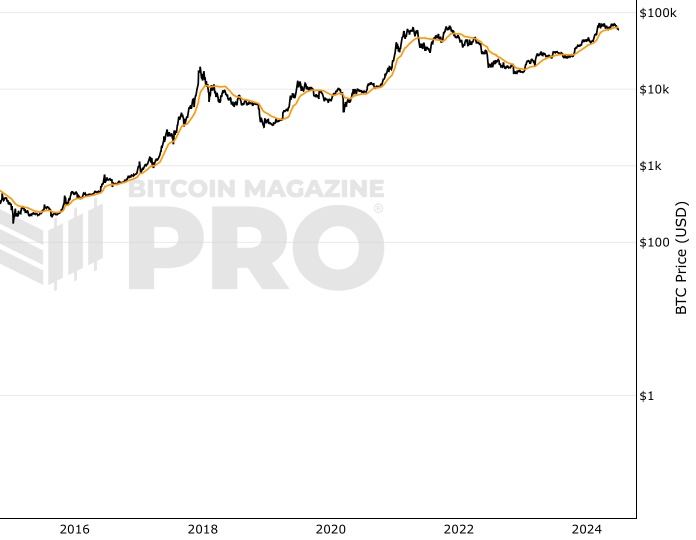
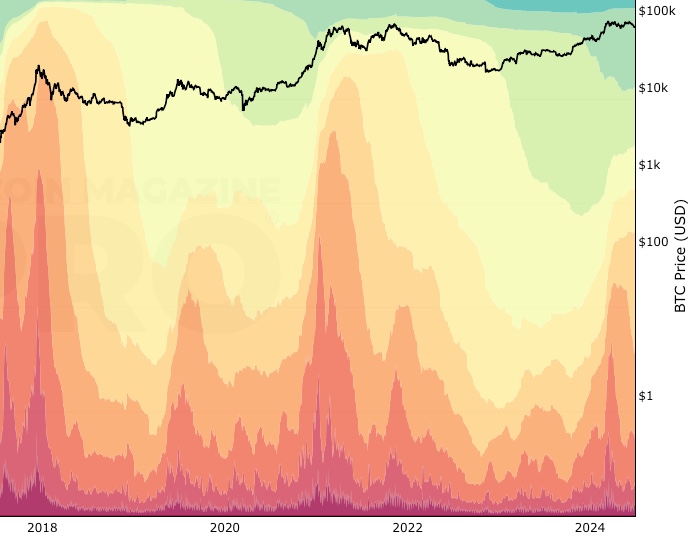
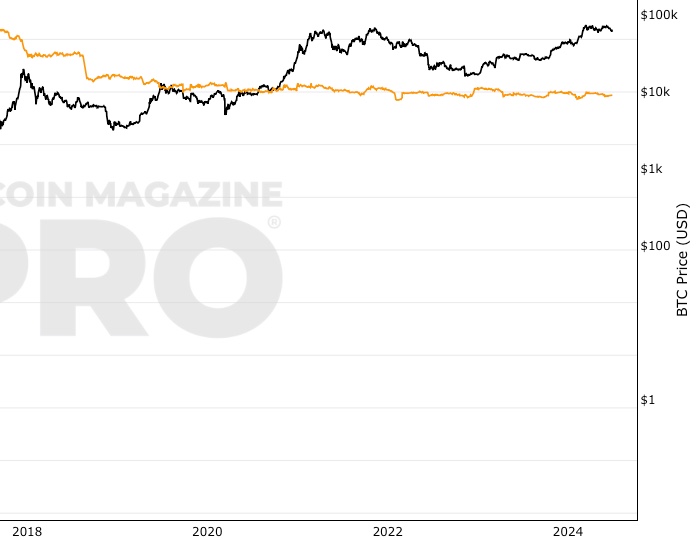
200 Week Moving Average Heatmap
A simple heatmap system based on movements of the 200 week moving average.
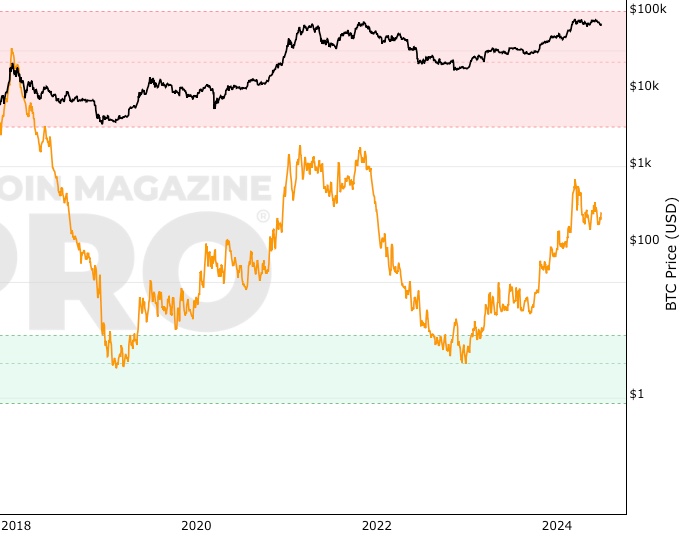
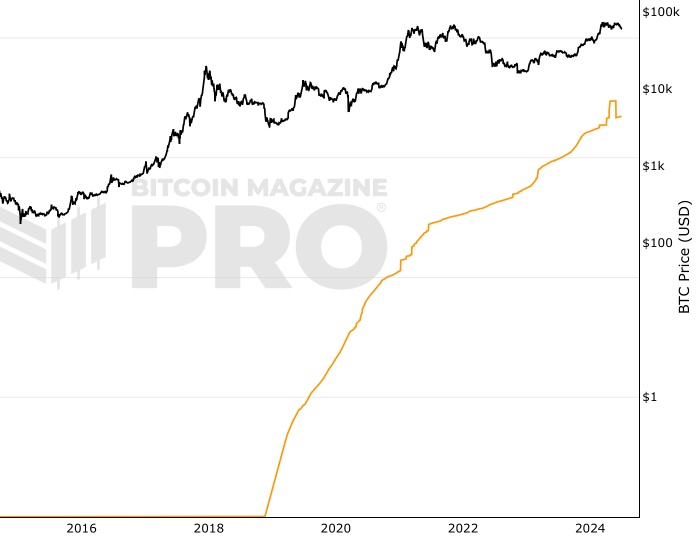
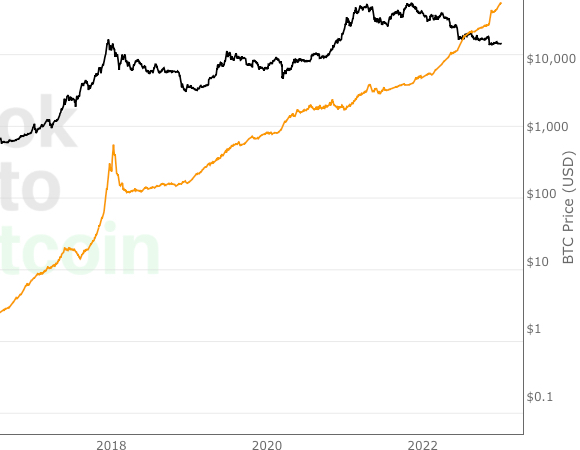
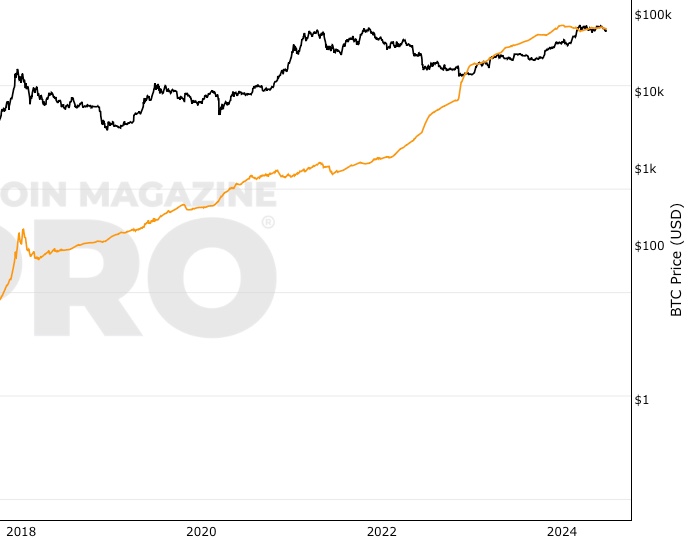
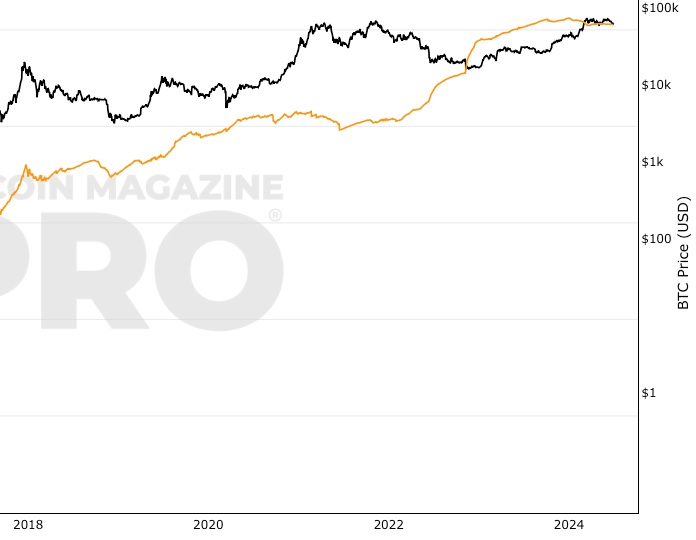
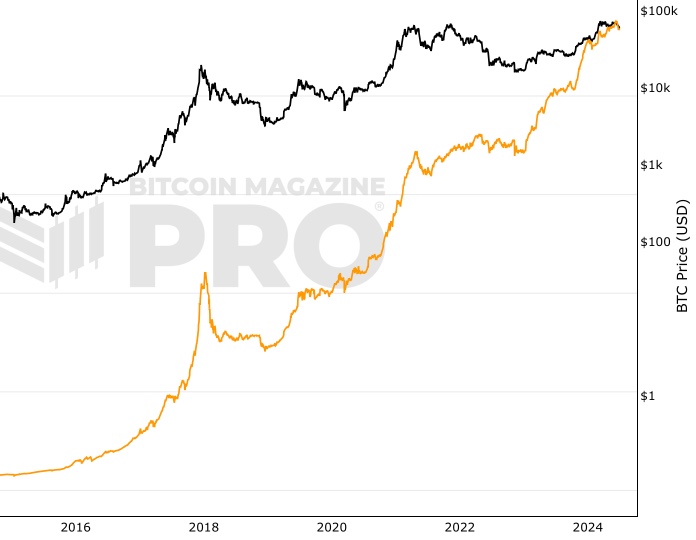
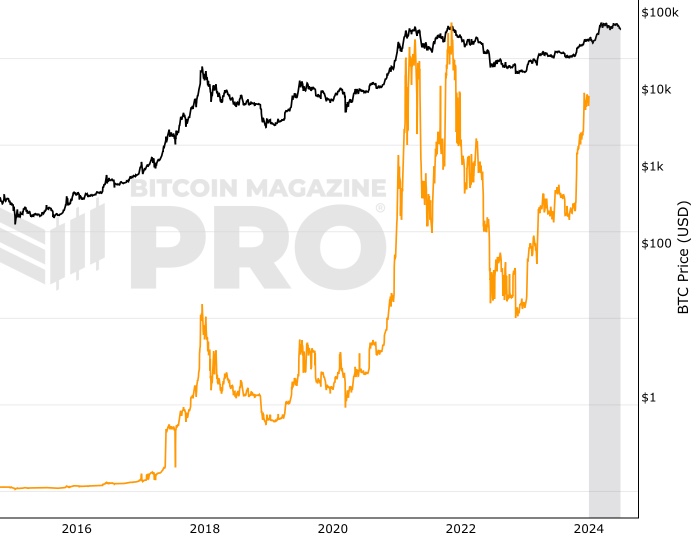
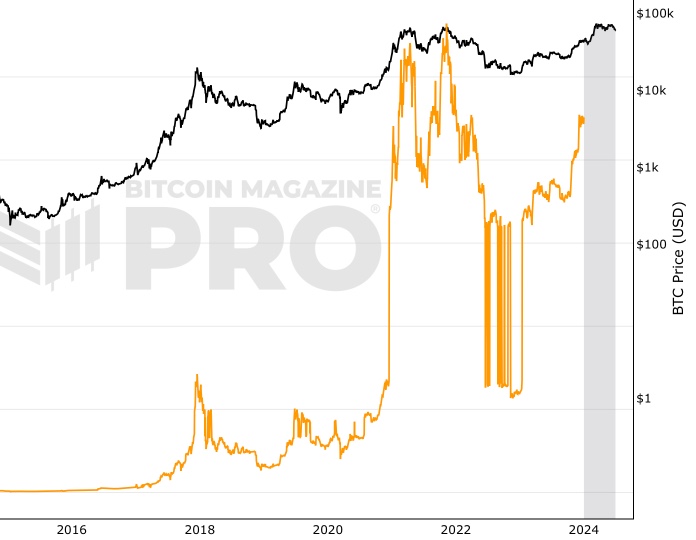
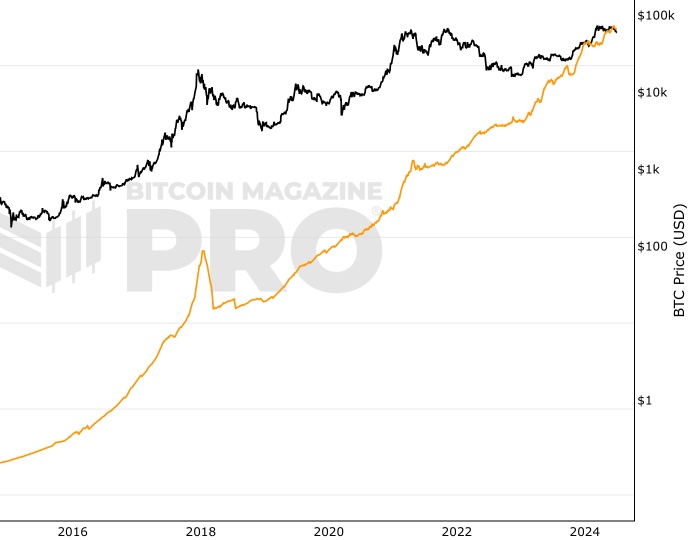
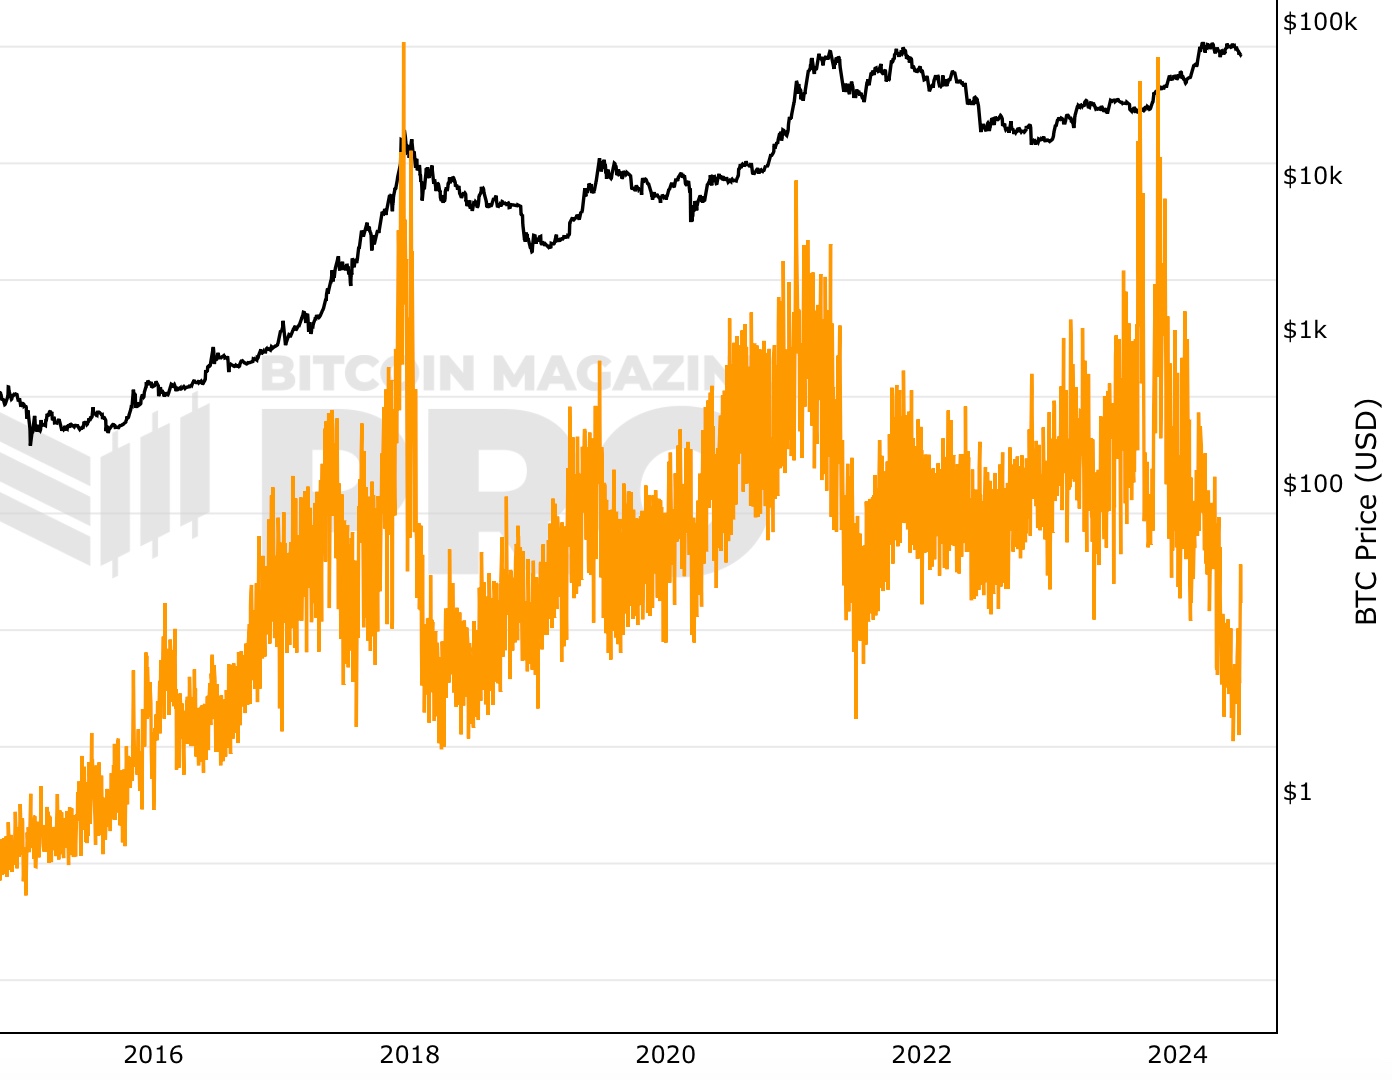
Stock-to-Flow Model
Ratio of bitcoins in circulation relative to the amount of bitcoins annually mined, and this ratio's relationship with price
Fear And Greed Index
Market sentiment tool gauging investor fear and greed over time.
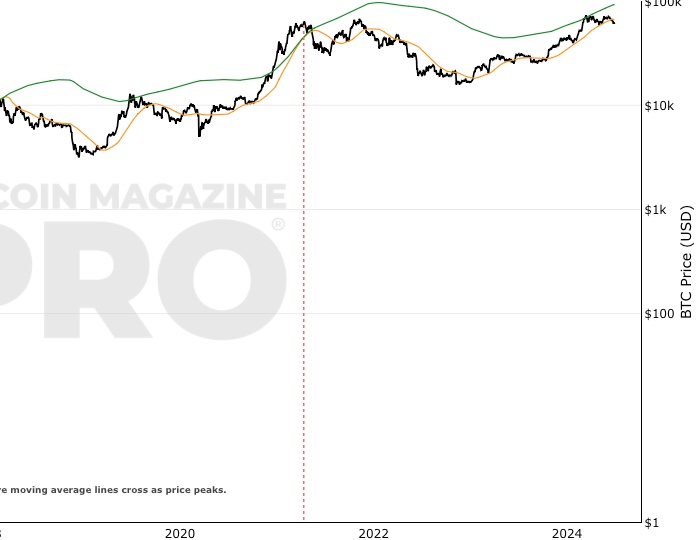
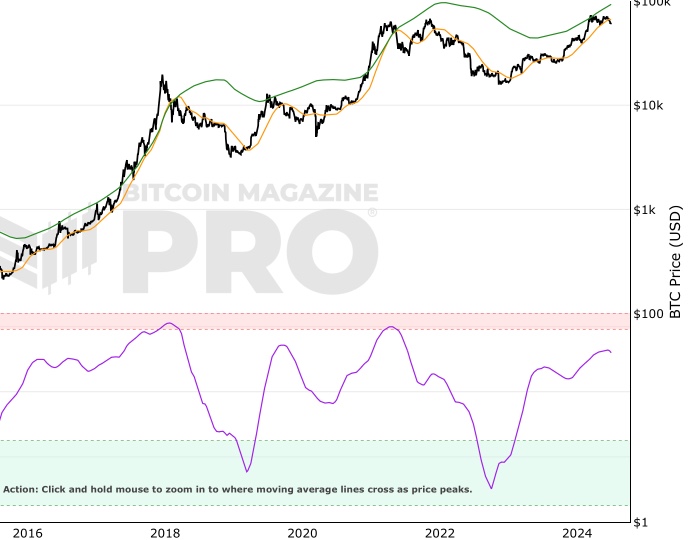
Pi Cycle Top Indicator
Moving average and moving average multiples to pick market cycle highs to within 3 days.
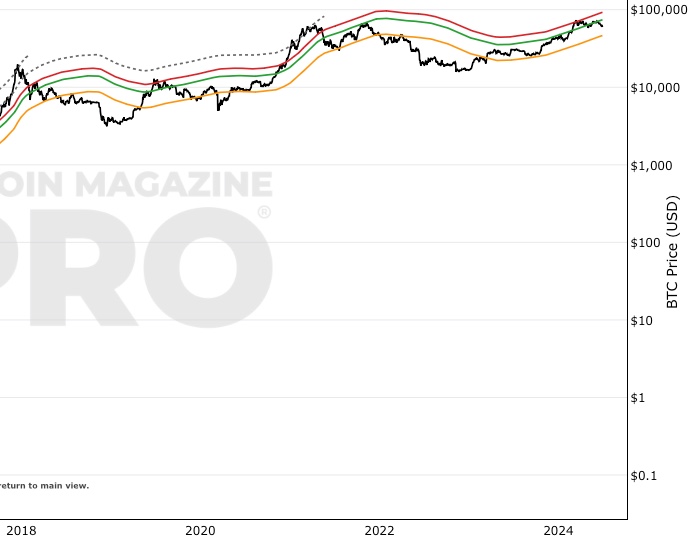
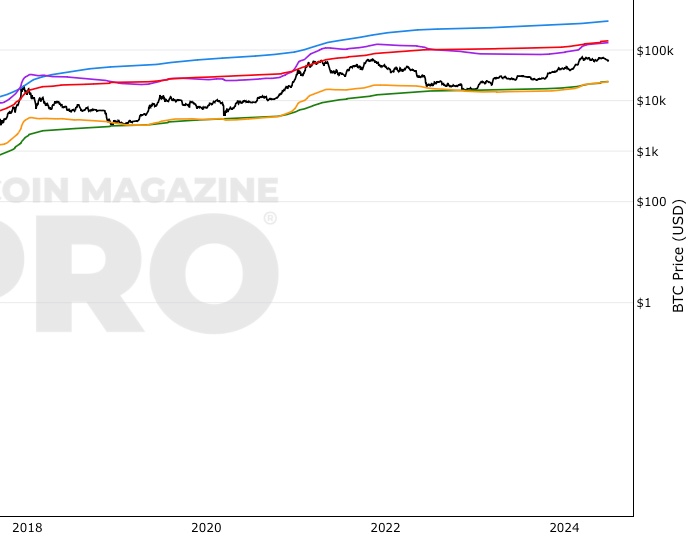
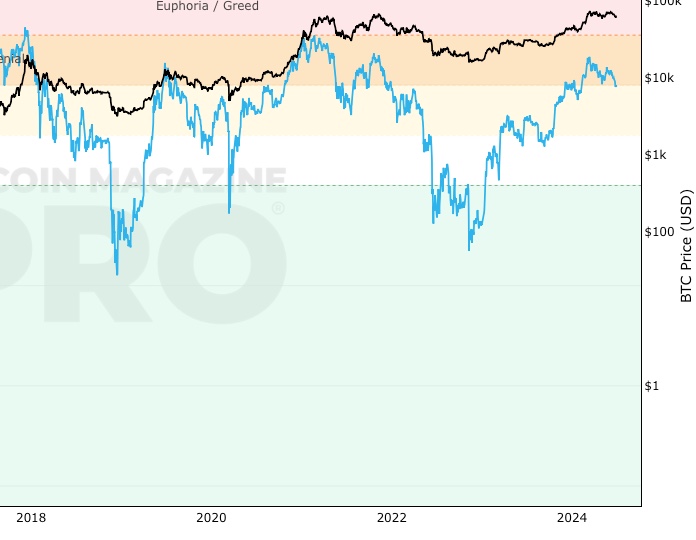
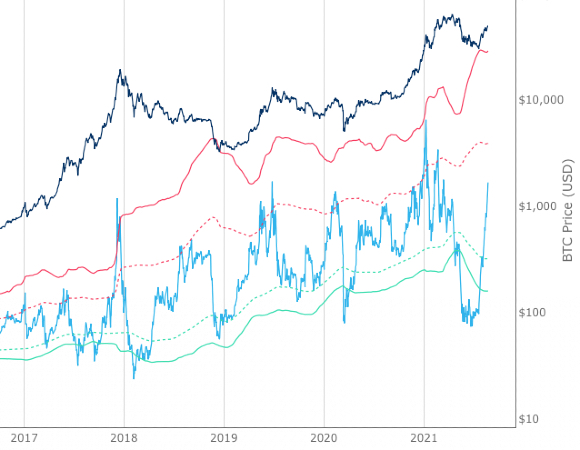
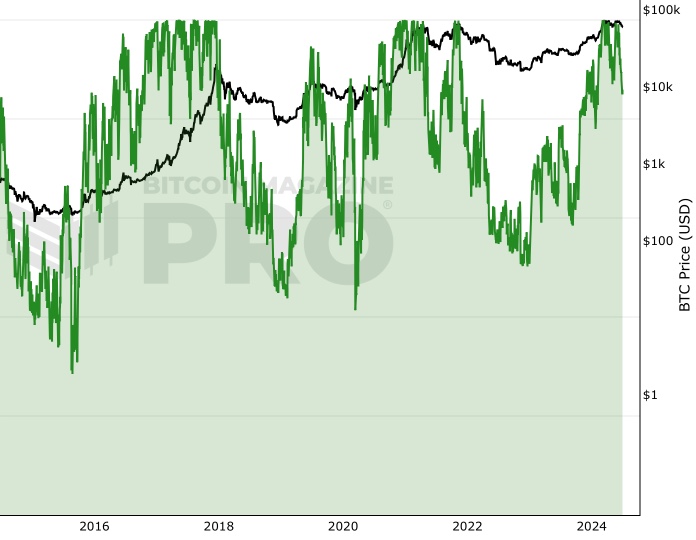
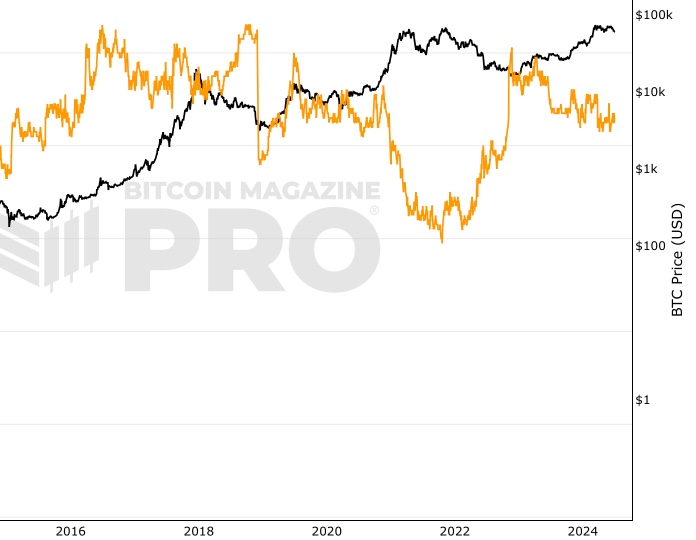
The Golden Ratio Multiplier
Uses Bitcoin's growth adoption curve and market cycles to identify both intracycle and full-cycle price highs.
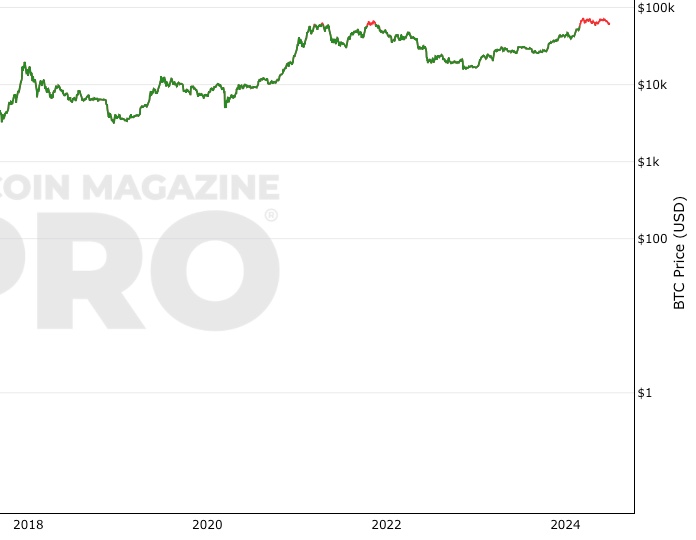
Bitcoin Profitable Days
The proportion of days in Bitcoin's traded history that it has been profitable to hold Bitcoin
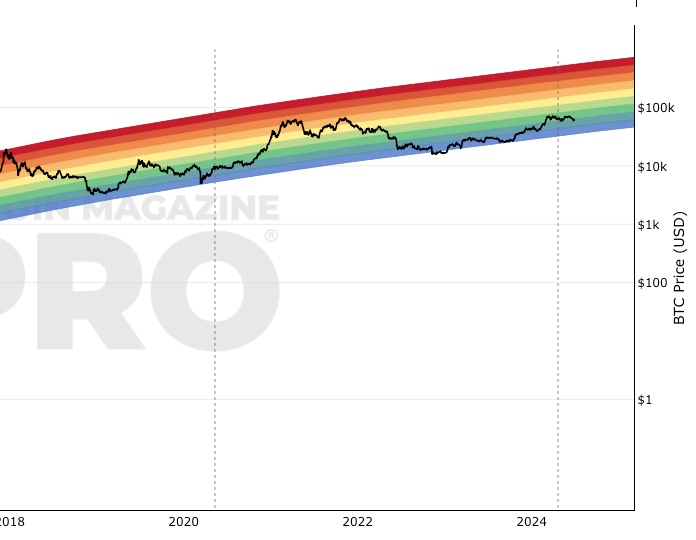
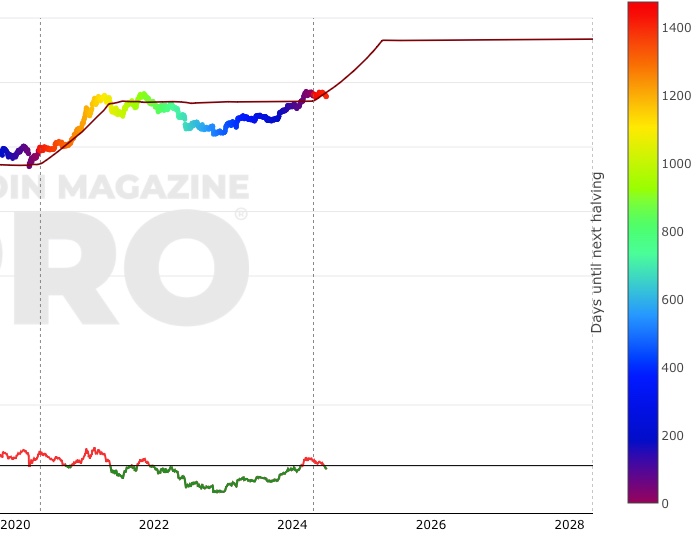
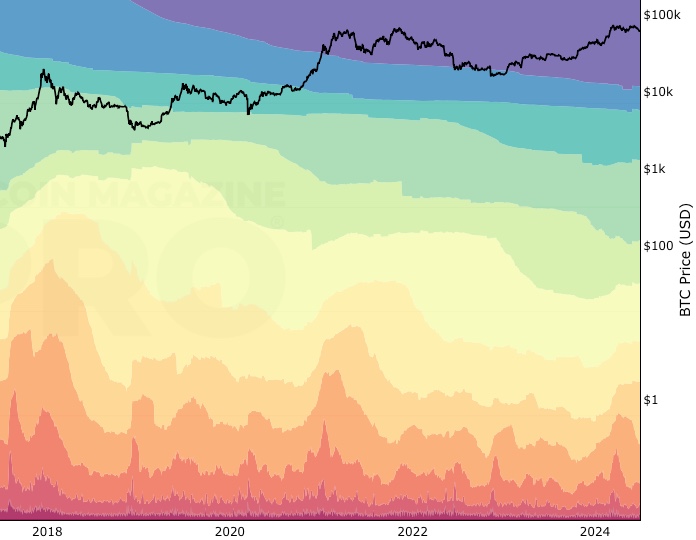
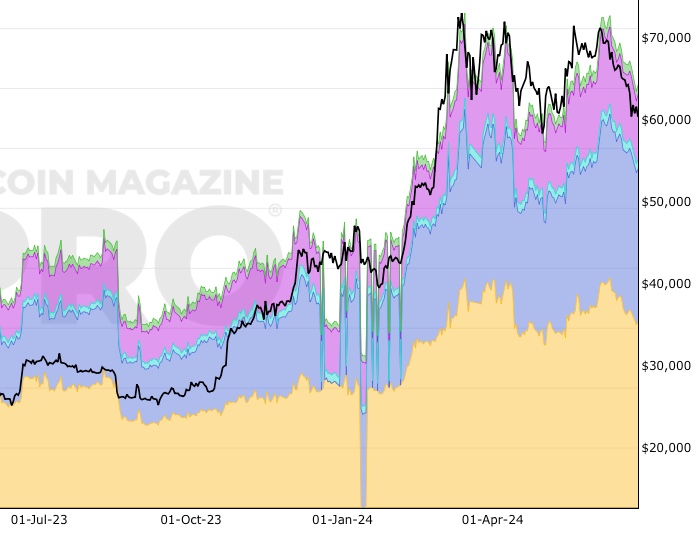
Bitcoin Rainbow Price Chart Indicator
Uses color bands overlaid on a log growth curve to highlight market stages.

Bitcoin Cycle MasterNew
A combination of on-chain metrics including Coin Value Days Destroyed and Terminal Price.
Pi Cycle Top & Bottom IndicatorNew
Pi Cycle Top and Bottom Indicator.
Onchain Market Indicators
Price Forecast Tools
Top Cap, Terminal Price, Delta Top, CVDD, Balanced Price
MVRV Z-Score
Pulls apart differences between Market Value and Realised Value to identify market cycle highs and lows.
RHODL Ratio
On Chain Indicator using Realized HODL Ratio’s to identify cycle high price tops.
Net Unrealized Profit/Loss (NUPL)
On-chain indicator for investor sentiment market stages
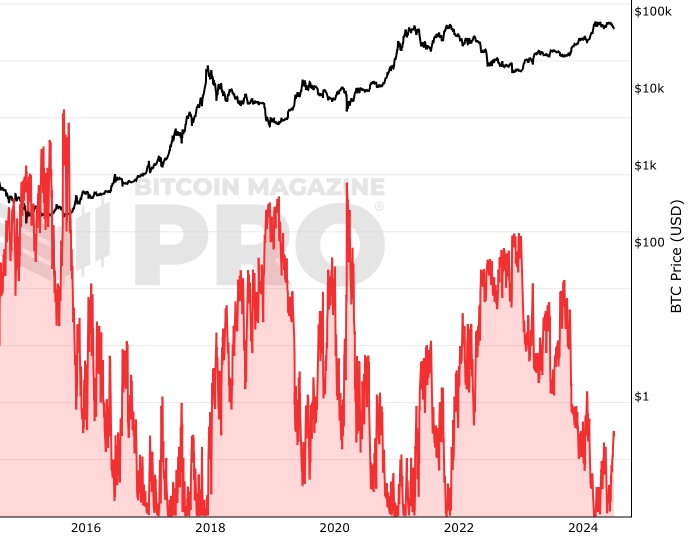
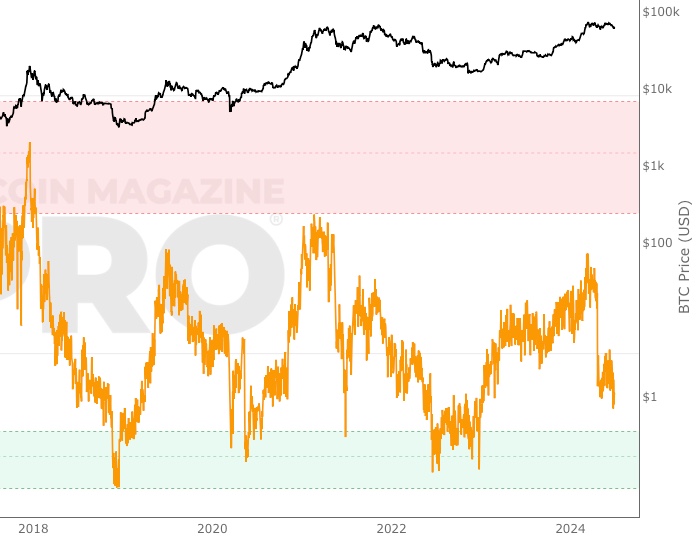
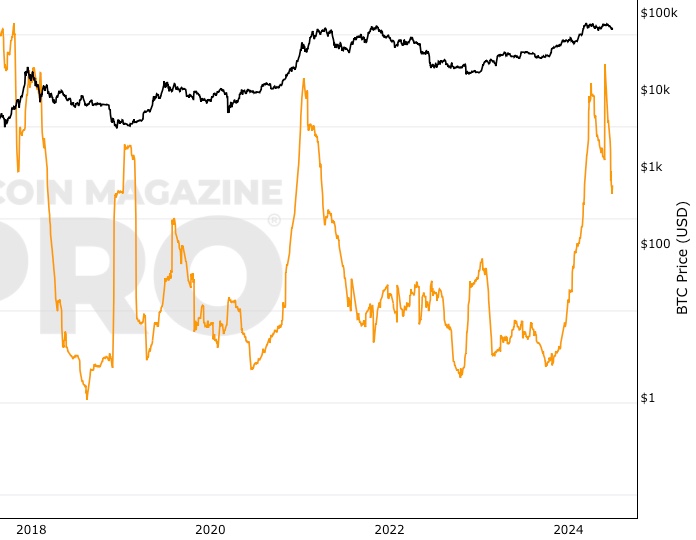
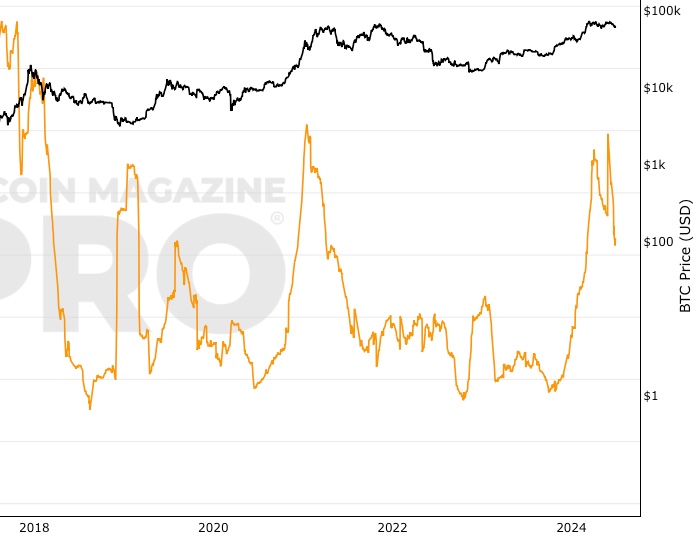
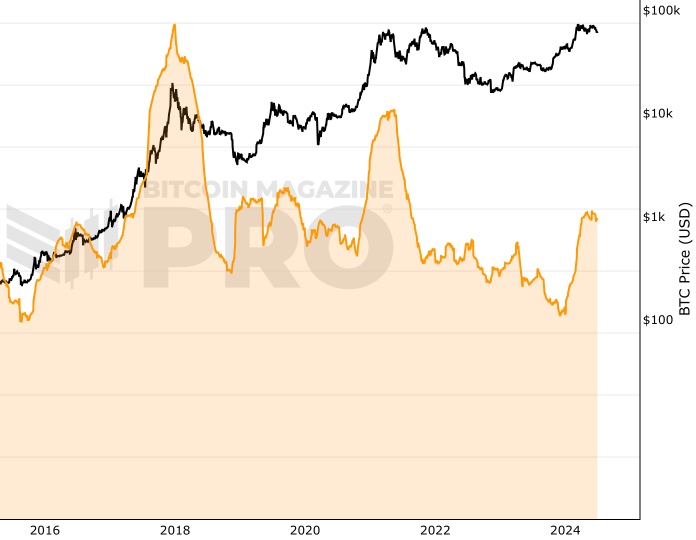
Reserve Risk
Long term Bitcoin investor confidence relative to Bitcoin price.
AASI (Active Address Sentiment Indicator)
Comparing change in price with change in number of addresses to determine if Bitcoin is over/undervalued in the short term.
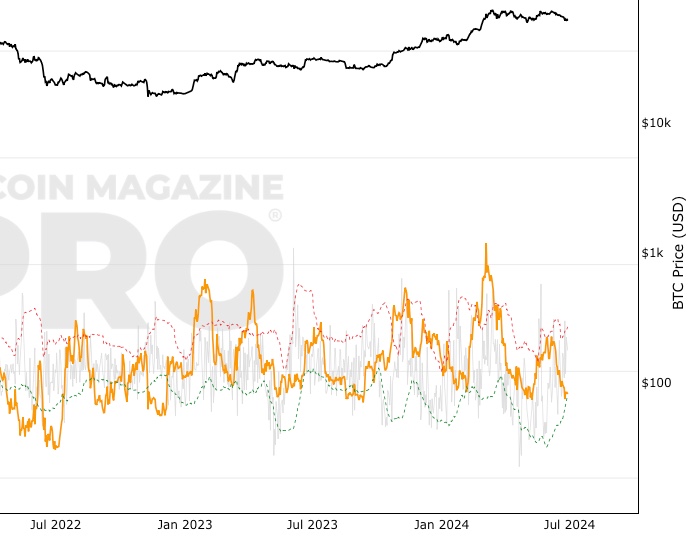
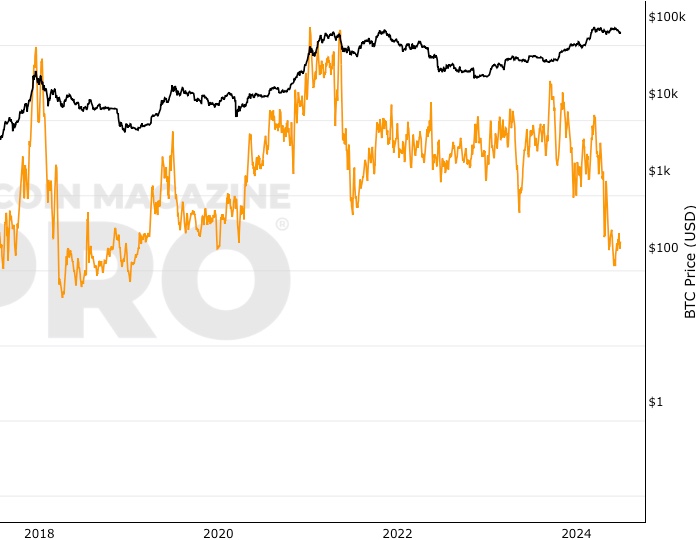
Advanced NVT Signal
This adaptation of NVT Signal adds standard deviation bands to identify when Bitcoin is overbought or oversold.
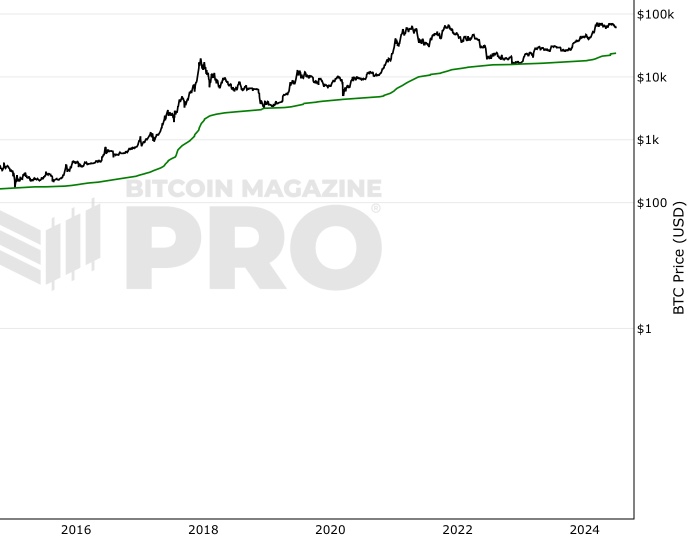
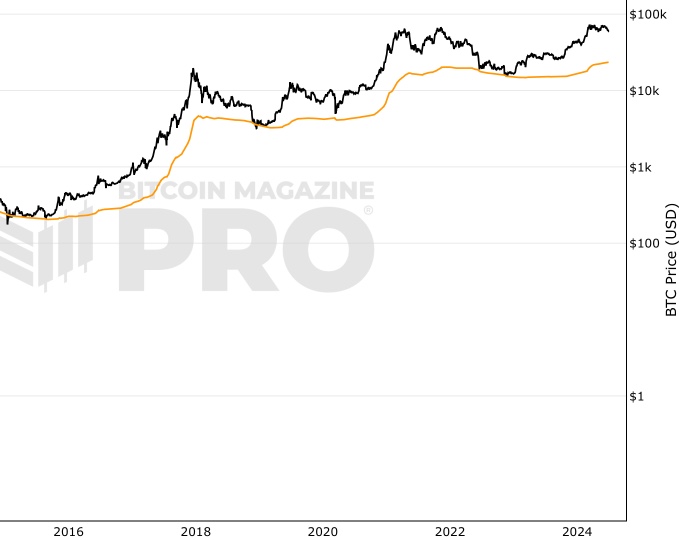
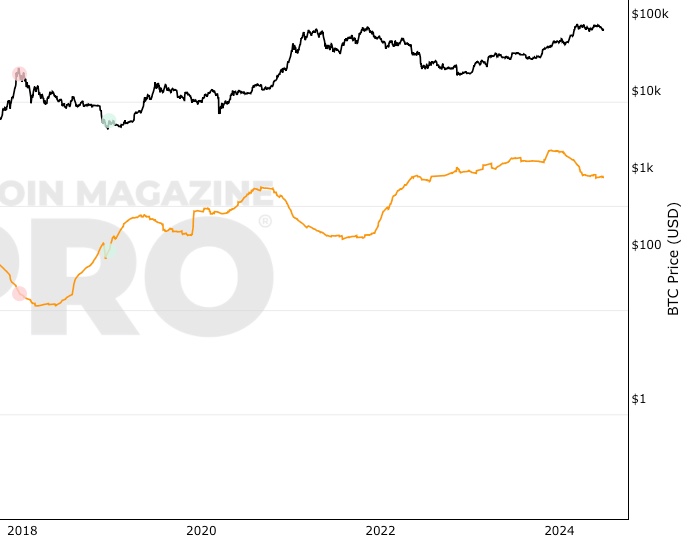
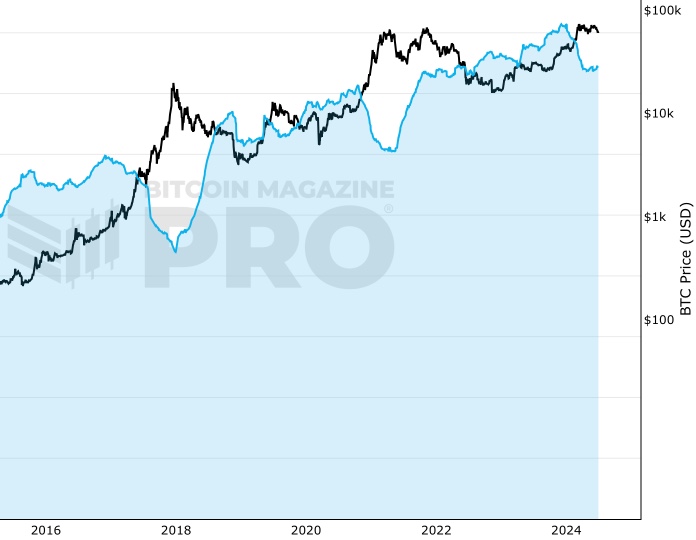
Realized Price
The aggregate cost-basis of all bitcoin.
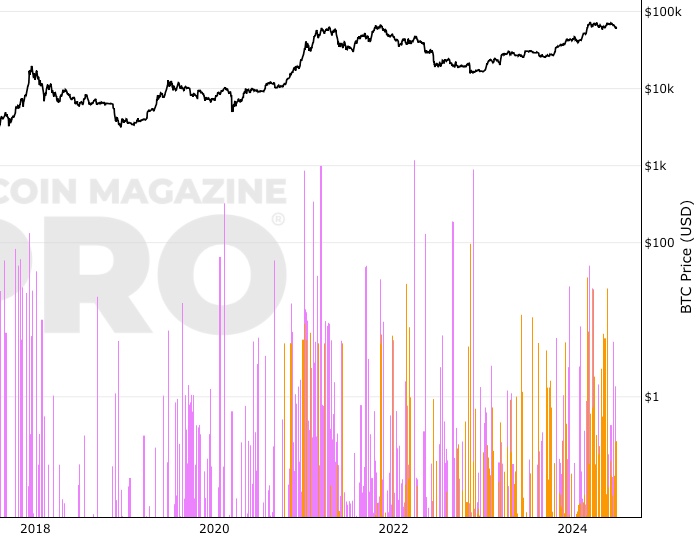
Value Days Destroyed (VDD) Multiple
Identifies Bitcoin cycle highs by comparing near-term spending velocity with yearly average of spending velocity.
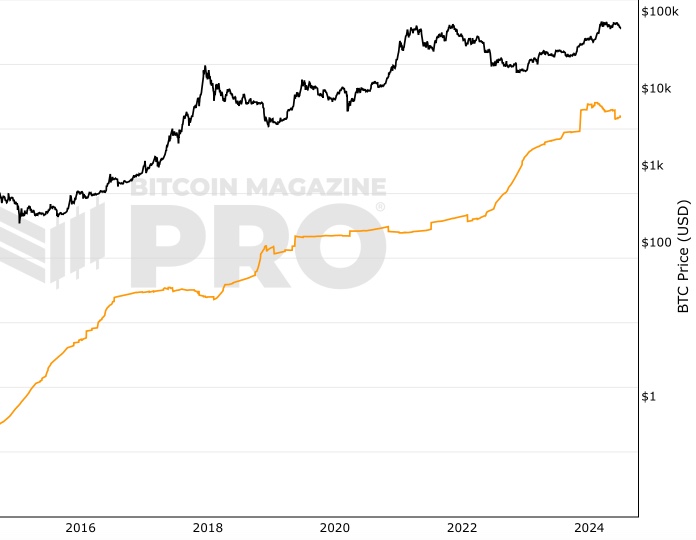
CVDD
Pricing model for identifying Bitcoin bear market lows.
Top Cap
Pricing model for identifying Bitcoin bull market highs.
Delta Top
Pricing model for identifying Bitcoin bull market highs.
Balanced Price
Pricing model for identifying Bitcoin bear market lows.
Terminal Price
Pricing model for identifying Bitcoin bull market highs.
Long-Term Holder Realized PriceNew
Average price at which long-term investors have purchased their Bitcoin.
Short-Term Holder Realized PriceNew
Average price at which short-term investors have purchased their Bitcoin.
Percent Addresses in ProfitNew
The Percentage of Bitcoin Addresses in Profit.
Percent Addresses in LossNew
The Percentage of Bitcoin Addresses in Loss
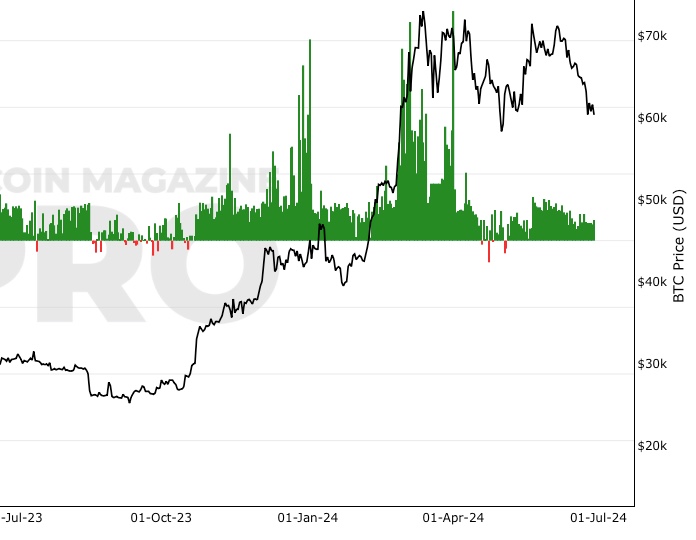
Puell Multiple
Relationship between daily bitcoin issuance and price.
Onchain Movement Charts
HODL Waves
Percentage of bitcoins that have last moved on-chain within specific time frames.
1+ Year HODL Wave
View of the percentage of coins HODL'd on the blockchain for over 1 year.
5+ Years HODL Wave
Bitcoin 5+ year HODL wave chart, showing percentage of bitcoin that has not moved onchain for 5+ years.
10+ Years HODL Wave
Bitcoin 10+ year HODL wave chart, showing percentage of bitcoin that has not moved onchain for 10+ years.
Realized Cap HODL Waves
The cost basis of UTXO’s held within specific age bands.
Whale Shadows (aka Revived Supply)
Onchain tracking of old coins moving again in large amounts.
Coin Days Destroyed
Number of coins multiplied by days since those coins last moved on-chain.
Supply Adjusted Coin Days Destroyed
Number of coins multiplied by days since those coins last moved on-chain, adjusted for bitcoin supply.
Long Term Holder SupplyNew
Circulating bitcoin supply that is held by long term holders.
Short Term Holder SupplyNew
Circulating bitcoin supply that is held by short term holders.
Address Balance Charts
Bitcoin Active Addresses
The number of Bitcoin Active Addresses.
Addresses Holding > X BTC by Year
Addresses holding x btc by year.
Addresses with Balance > 0.01 BTC
Live chart showing the number of unique addresses holding at least 0.01 BTC.
Addresses with Balance > 0.1 BTC
Live chart showing the number of unique addresses holding at least 0.1 BTC.
Addresses with Balance > 1 BTC
Live chart showing the number of unique addresses holding at least 1 BTC.
Addresses with Balance > 10 BTC
Live chart showing the number of unique addresses holding at least 10 BTC.
Addresses with Balance > 100 BTC
Live chart showing the number of unique addresses holding at least 100 BTC.

Addresses with Balance > 1,000 BTC
Live chart showing the number of unique addresses holding at least 1,000 BTC.
Addresses with Balance > 10,000 BTCNew
Live chart showing the number of unique addresses holding at least 10,000 BTC.
Addresses with Balance > $1New
Live chart showing the number of unique addresses holding at least $1.
Addresses with Balance > $10New
Live chart showing the number of unique addresses holding at least $10.
Addresses with Balance > $100New
Live chart showing the number of unique addresses holding at least $100.
Addresses with Balance > $1kNew
Live chart showing the number of unique addresses holding at least $1k.
Addresses with Balance > $10kNew
Live chart showing the number of unique addresses holding at least $10k
Addresses with Balance > $100kNew
Live chart showing the number of unique addresses holding at least $100k.
Addresses with Balance > $1mNew
Live chart showing the number of unique addresses holding at least $1m.
Addresses with Non Zero BalanceNew
Live chart showing the number of unique non zero addresses.
Number of New AddressesNew
The number of unique addresses that appeared for the first time in a transaction on the Bitcoin network.
Mining Charts
The Puell Multiple
Relationship between daily bitcoin issuance and price.
Bitcoin Hashrate
Bitcoin network hashrate.

Hash Ribbons Indicator
Hash Ribbons Indicator: Highlights miner capitulation to identify major price lows.
Bitcoin Miner Difficulty
Changes in Bitcoin mining difficulty over time.
Miner Revenue (Total)
Total Bitcoin miner revenue: fees + mining reward.
Miner Revenue (Block Rewards)
Bitcoin miner revenues earned from block rewards.
Miner Revenue (Fees)
Bitcoin miner revenues earned from fees.
Miner Revenue (Fees vs Rewards)
Percentage comparison of Bitcoin miner revenues earned from fees and mining rewards.
Lightning Network Charts
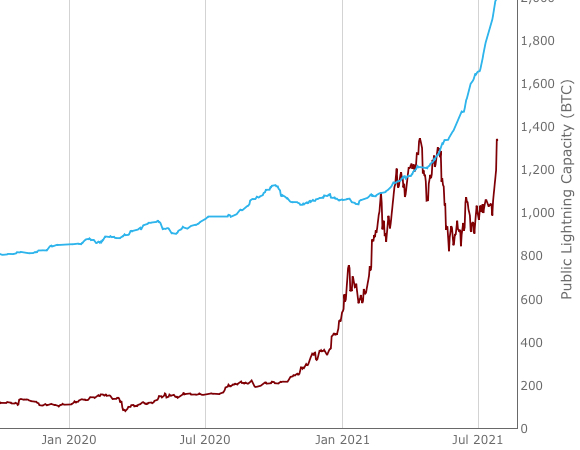
Bitcoin Lightning Capacity
Cumulative capacity held by all nodes on the Lightning Network.
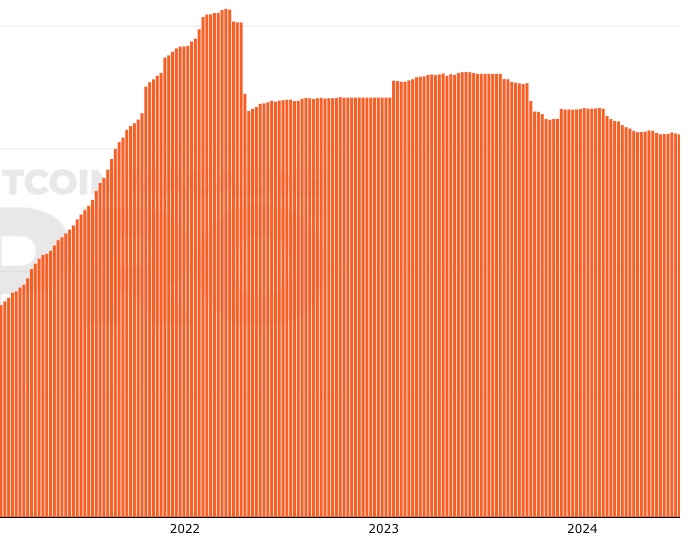
Bitcoin Lightning Nodes
Total number of Bitcoin Lightning nodes.
Derivatives Charts
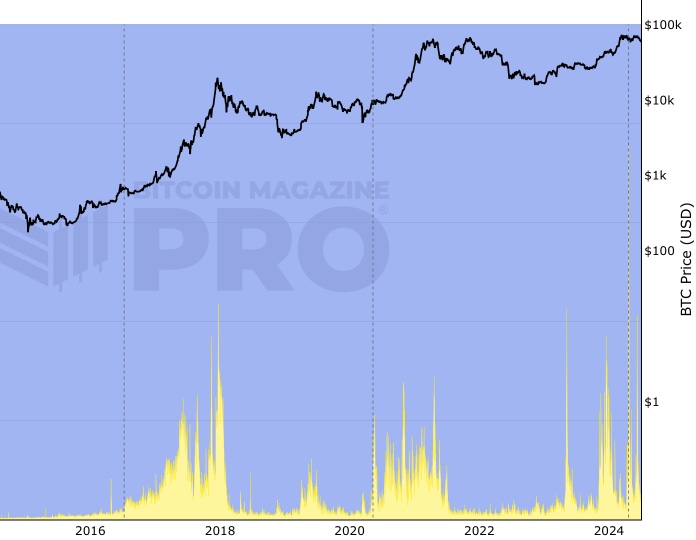
Bitcoin Open Interest
Value of open derivative contracts.
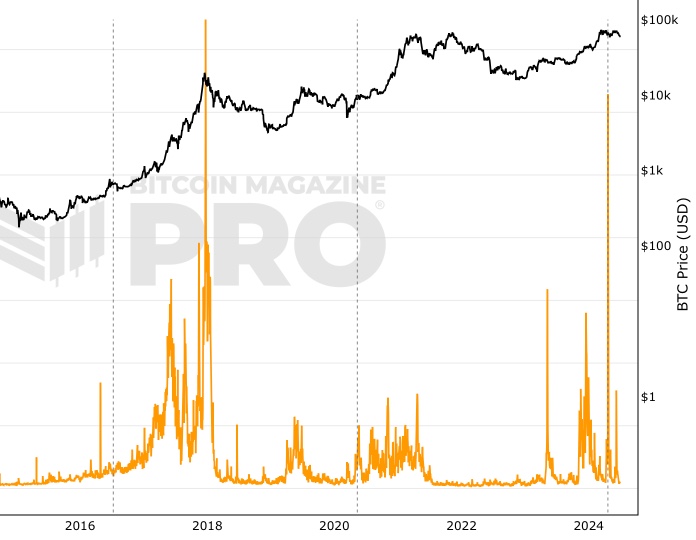
Bitcoin Funding Rates
Perpetual contract funding rates.
Please note, the indicators above are experimental. There is no guarantee certain rules within each model will continue to apply as Bitcoin progresses along its adoption journey. Any information on this site is not to be considered financial advice. Please review the Disclaimer section for more information.