Viewing the charts on this site
When you read an article about the price of Bitcoin or see a news reporter talk about it on TV, they typically show a chart for the price of Bitcoin on a standard scale. It looks something like this:
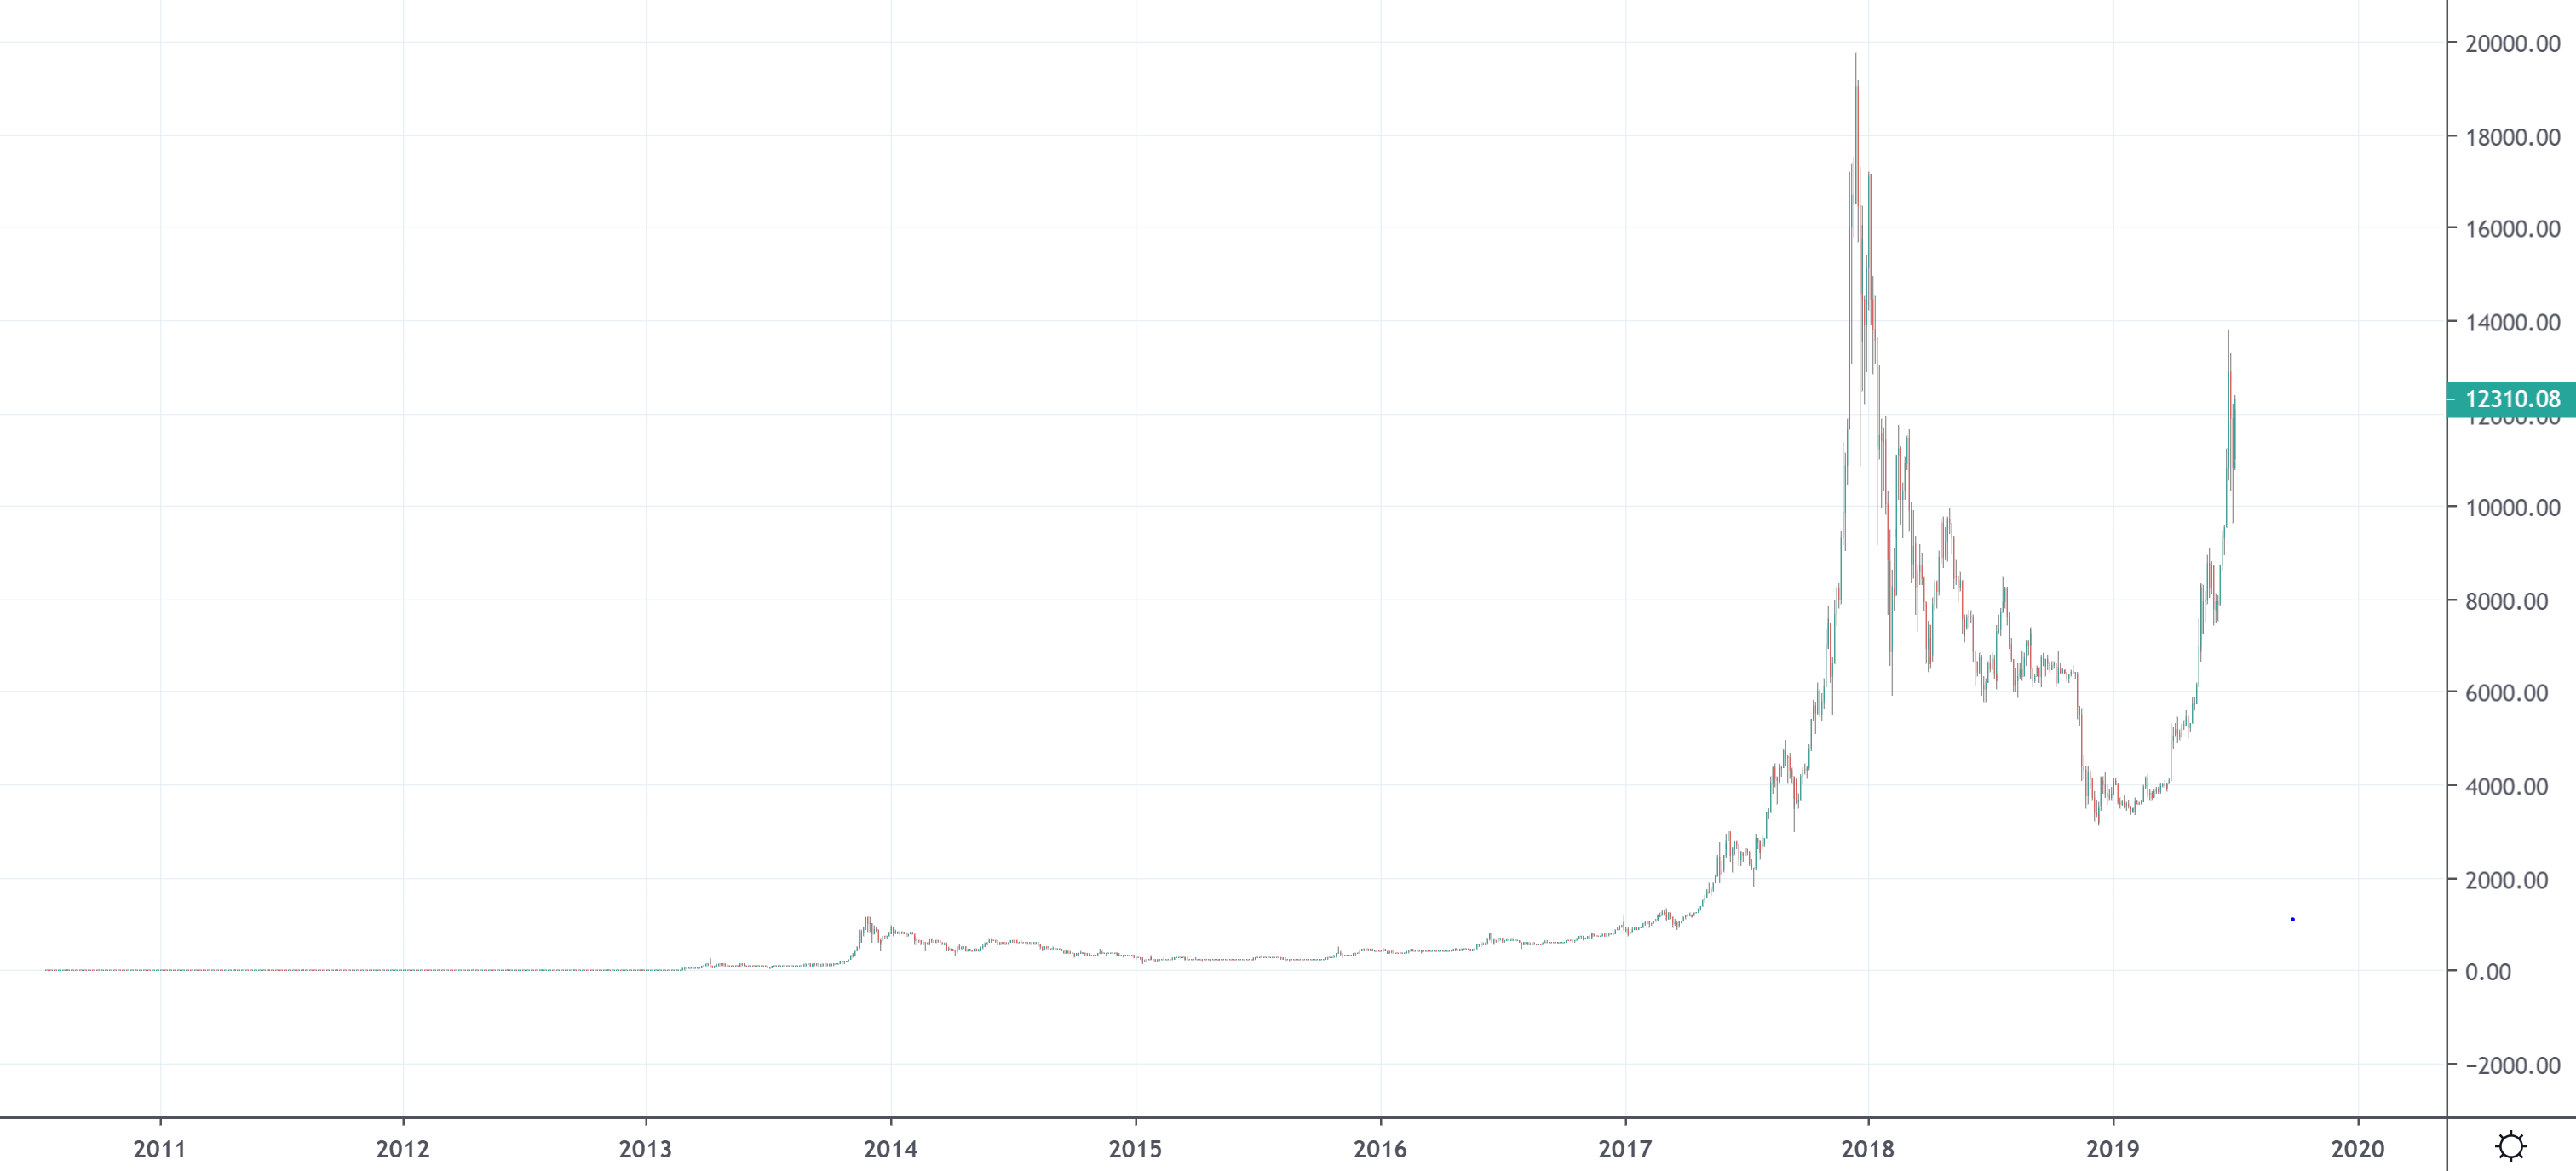
Only looking at Bitcoin's price in this way is problematic. It shows two huge spikes in the past 18 months and not much else, leading many to jump to the conclusion that Bitcoin is just a bubble.
Bitcoin is a technology that is being adopted very quickly over time. Like anything that is growing so fast, we preferably want to view it on a logarithmic scale. This means that the price scale (y-axis) increases by powers of 10. Viewing it this way evens out the more recent volatility and allows us to see trends in the data over time that were not visible on a standard scale:
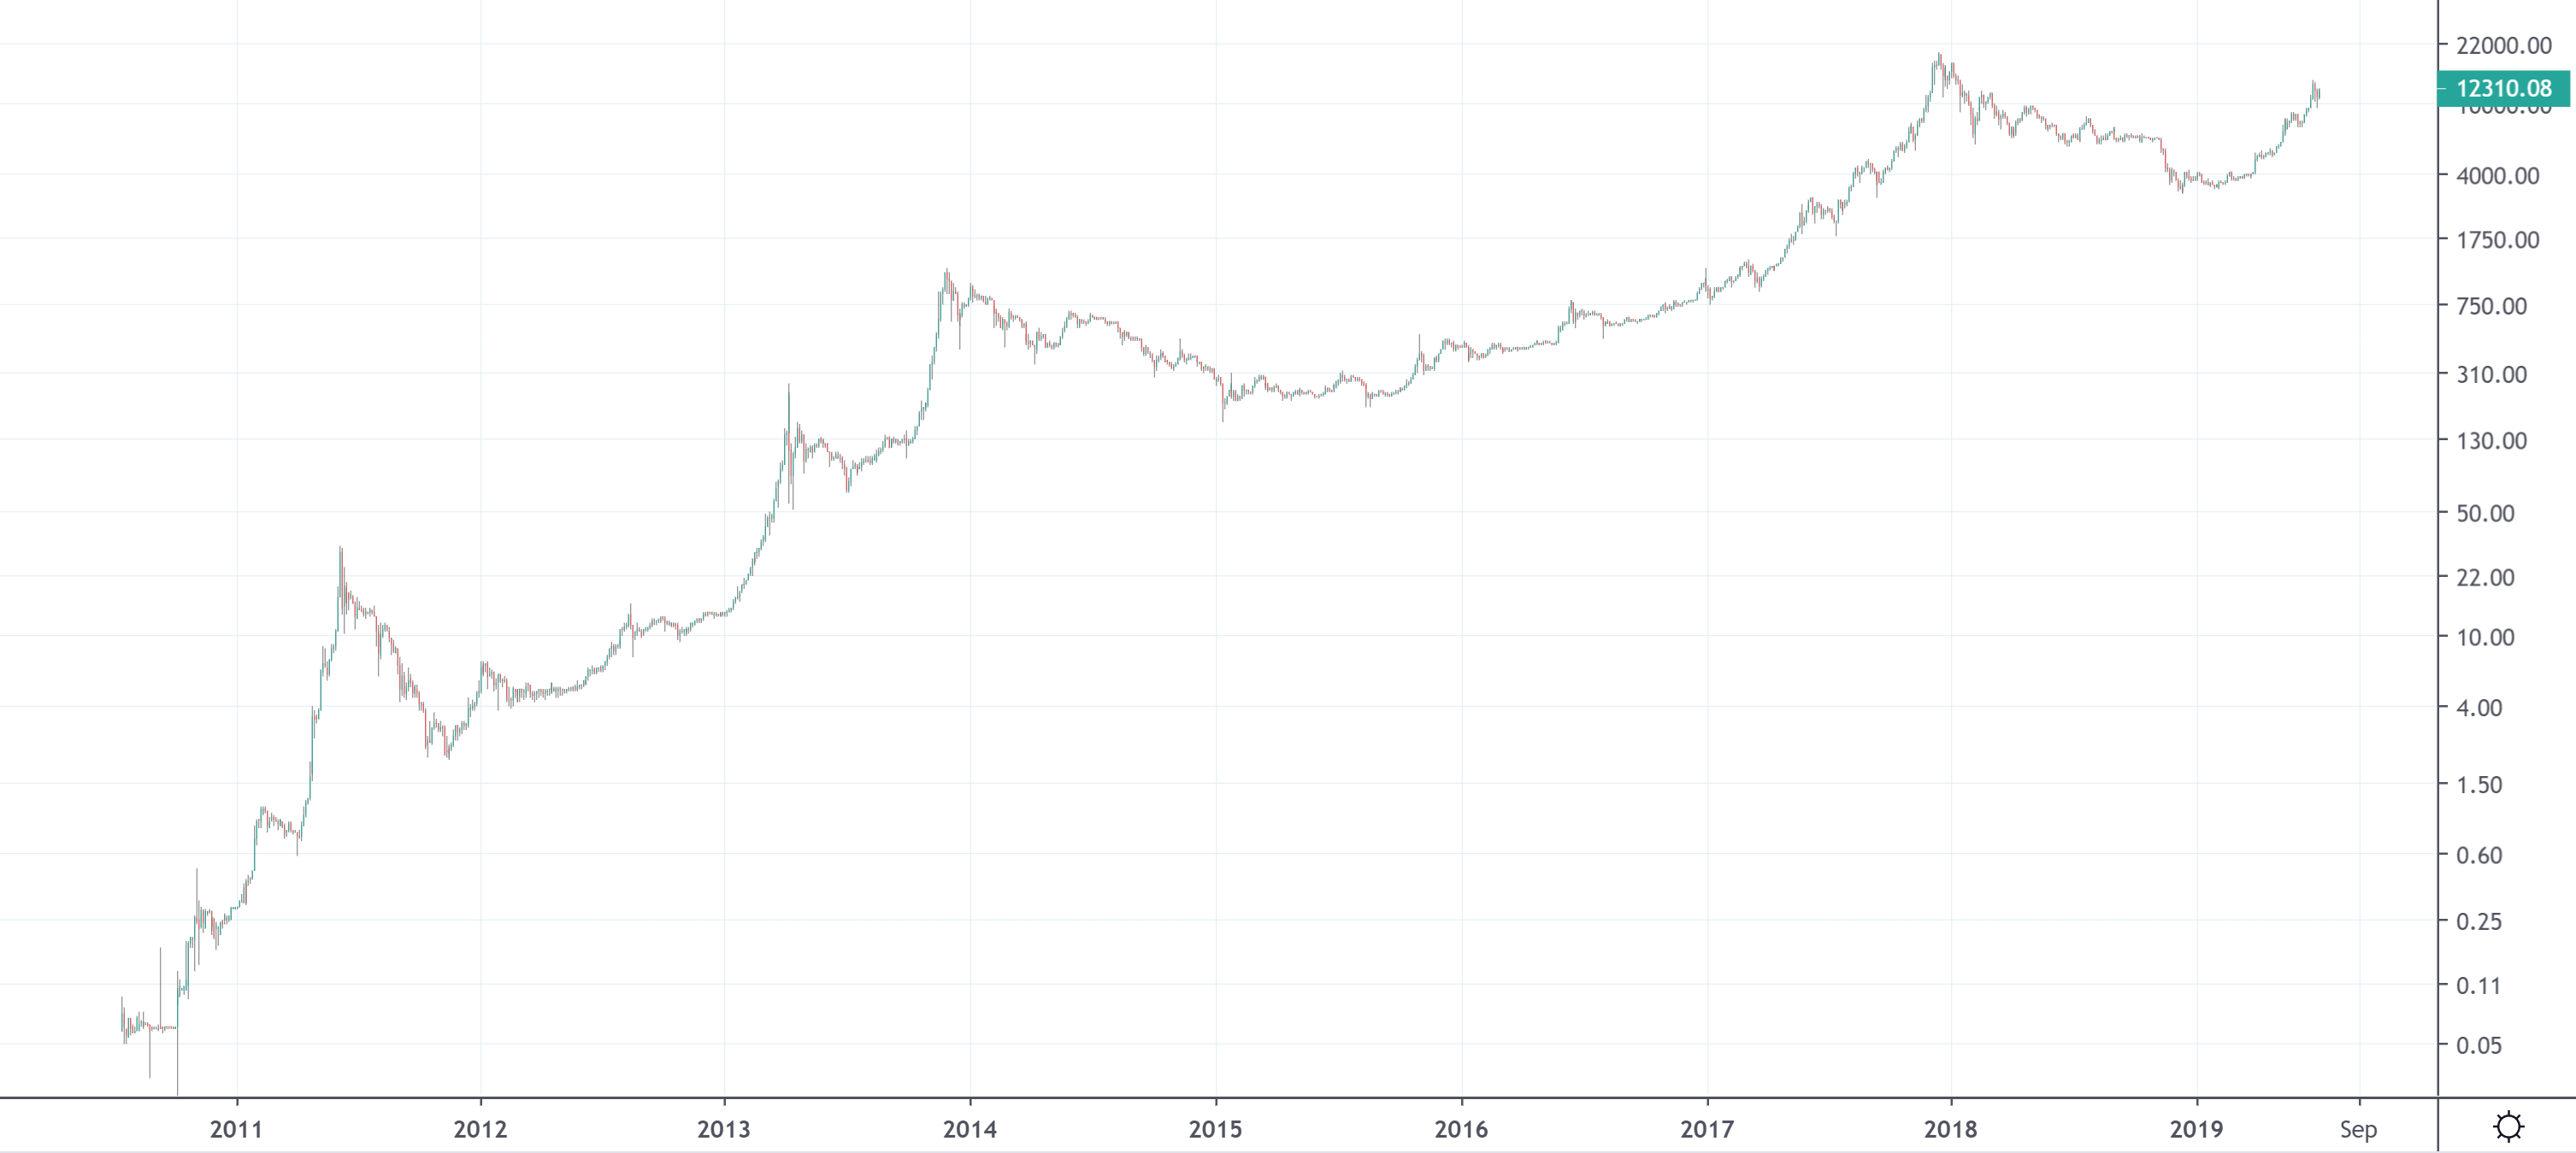
Using the log scale, we can now see the broad arc shape of Bitcoin's price curve rise over time as more people buy Bitcoin forcing its price to increase. This is the adoption curve of Bitcoin.
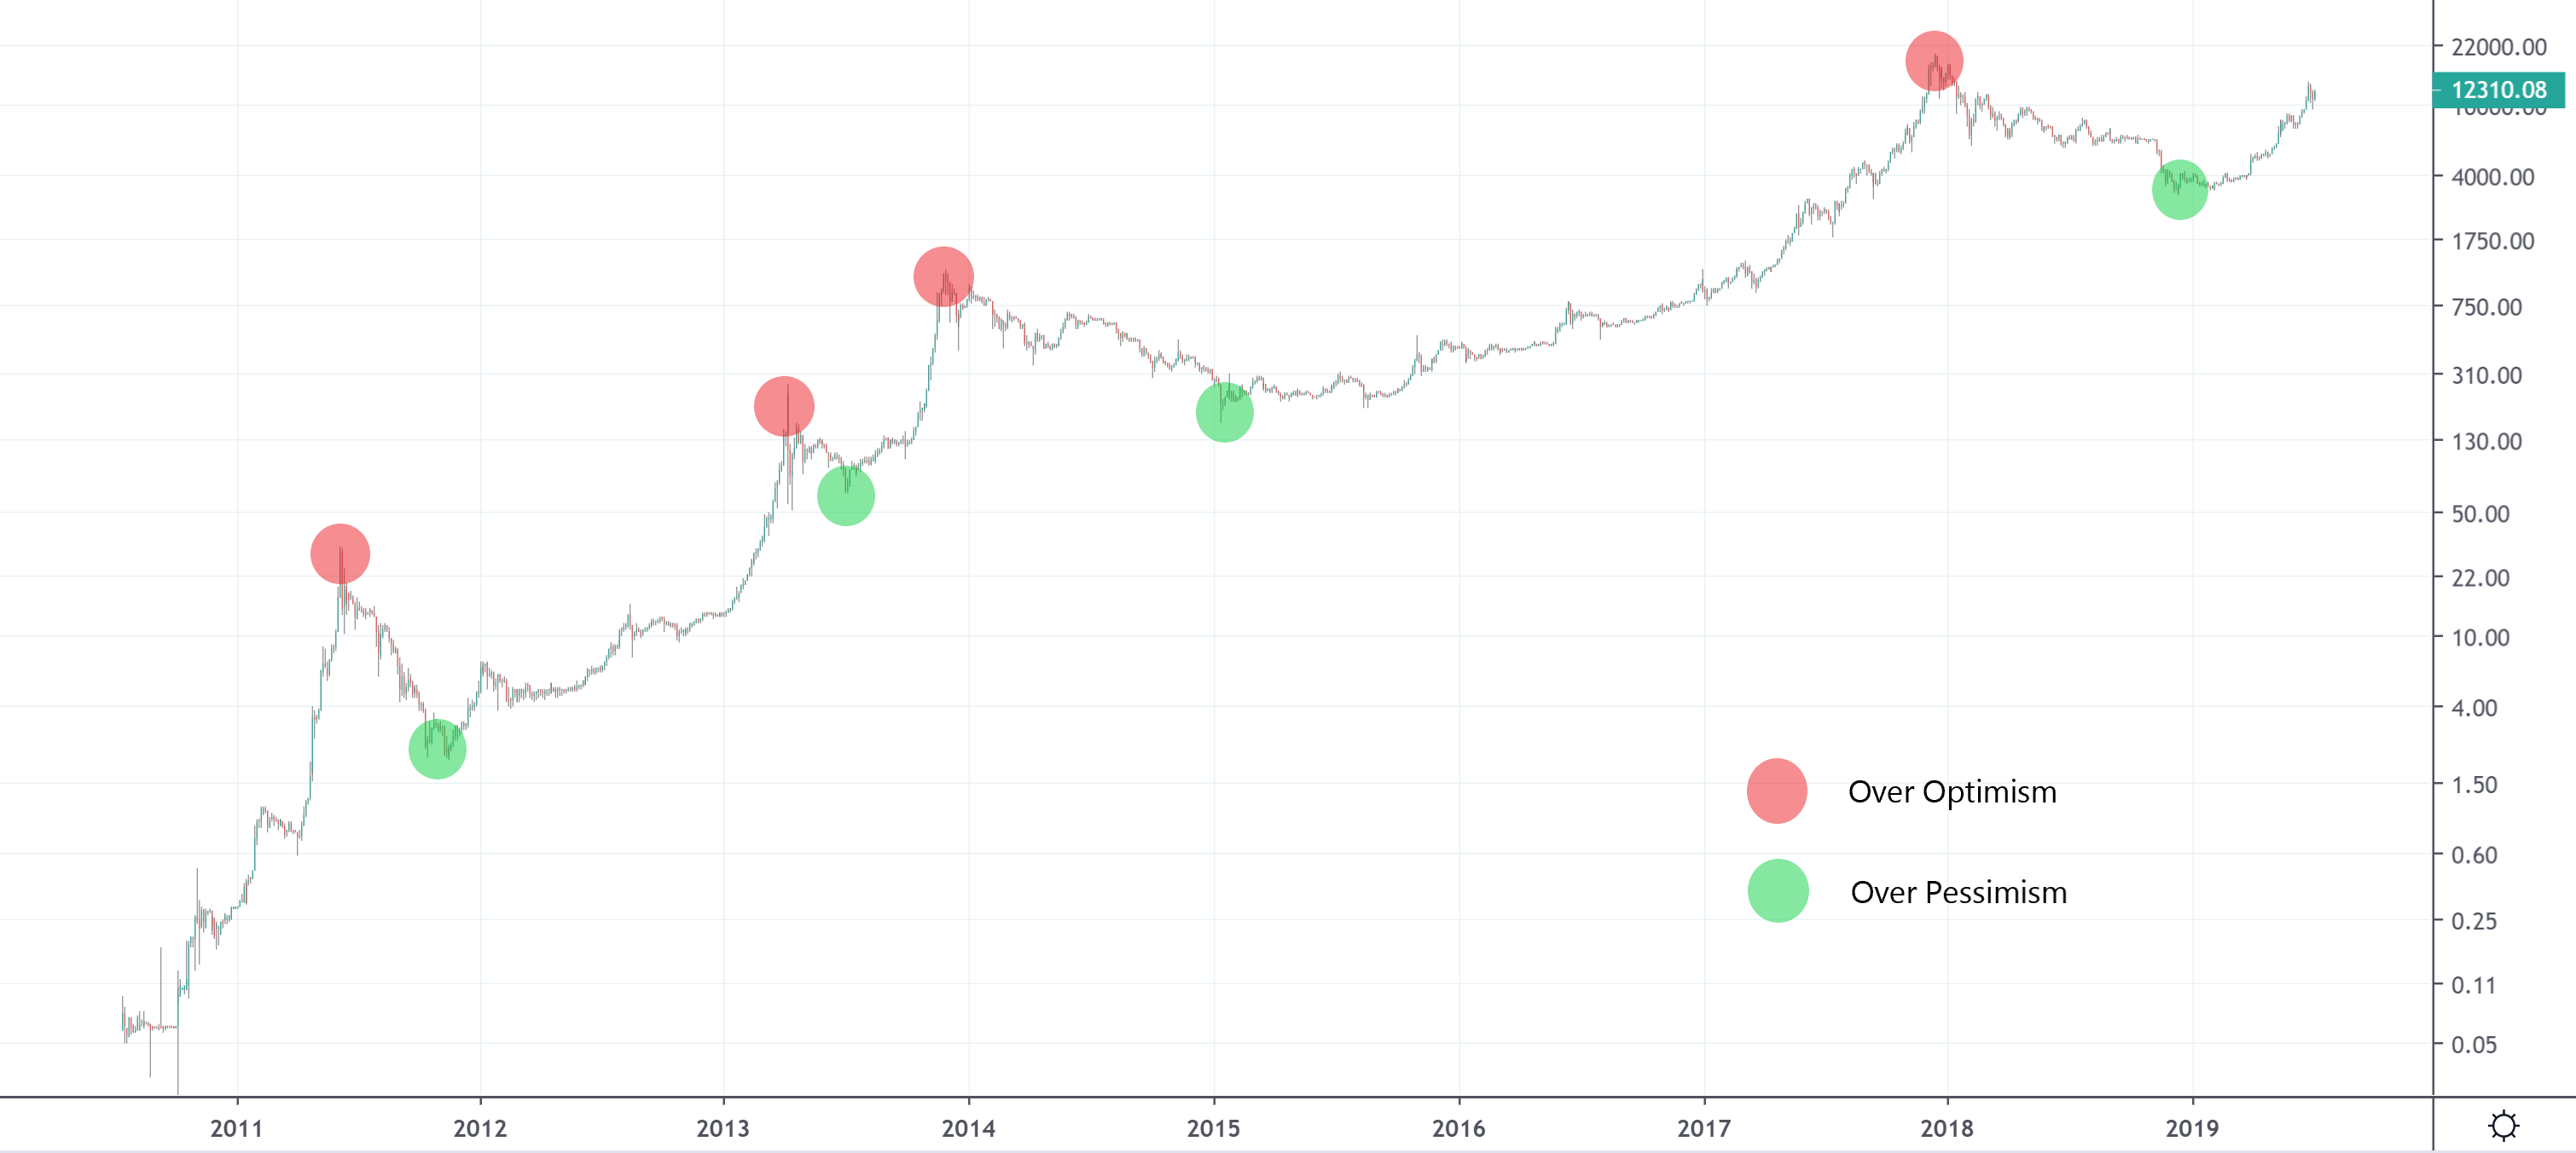
On top of that adoption curve we can see the market cycles that Bitcoin moves through. These are stages where the market becomes over optimistic (price peaks) and over pessimistic (price bottoms).
You can now use the charts on this site because you know:
1. Viewing Bitcoin's price chart on a log scale allows us to see trends over time.
2. Bitcoin's price is behaving like the adoption curve of a technology being adopted very quickly.
3. On top of that adoption curve, Bitcoin's price goes through market cycles.
Charts grouped by ease of use
All the charts and supporting information on this site are designed to be accessible for everyone, including those new to Bitcoin investing.
However, new investors may choose to start with more straightforward charts before moving on to the other charts on the site. The more straightforward charts are:
There are no recommendations given on which charts should be used over others. This site does not give financial advice and should investors wish to use the charts, they can decide which combinations of charts they find most useful.
Bitcoin and its market cycles
Bitcoin goes through market cycles. Each cycle has a period where the price peaks as people become overexcited about Bitcoin, and a period where price bottoms out as people become overly pessimistic about its future.
Market cycles are not unique to Bitcoin, we see them in many other markets. For example, real estate has these cycles also, but on longer time frames. Market cycles are simply the result of market participants psychology affecting the price of the product over time.
Understanding that Bitcoin is cyclical is very important for a Bitcoin investor. Prices surging and then falling back are in the grand scheme of things nothing to be overly concerned about. We also see that with each cycle, the price of Bitcoin falls back to a higher base than the base of the previous cycle i.e. price is increasing over time with each cycle as Bitcoin continues to be adopted.
We use market cycles as part of our analysis because if we know Bitcoin goes through these cycles then we broadly know where it is likely to go next. For example, you’re less likely to keep buying at the top of a market cycle if you know that at some point the price will need to pull back.
The inevitable truth about market cycles is that most people buy towards the top, paying a high price, and sell low towards the bottom, receiving a low price. By understanding market cycles, it is possible to personally avoid this situation. As Bitcoin matures out of its adoption phase, it will likely exhibit different types of market cycles which are less formulaic than what we have seen in Bitcoin's first 10 years of growth. However these future cycles evolve, it is still very likely that there will still be periods of market euphoria and depression that will create cycles of some sort.
To see a good example of a chart that shows the Market Cycles of Bitcoin please refer to MVRV Z-score here.
The benefits of moving averages
A moving average is a commonly used indicator for identifying an asset's general direction, up or down. It gives an indication of trend direction because it smooths out short term volatile price movements.
It does this by taking the average price of the asset (Bitcoin in this case) over a number of days.
For example, Bitcoin's 50 day moving average is the average price of Bitcoin over the past 50 days. It's 200 day moving average is the average price over the past 200 days. The longer the moving average period, the more it lags behind the live price, because it contains prices for a longer time period.
The result is a smooth trend line over time compared to the actual live price line which is more erratic.
Because the price of Bitcoin goes through market cycles, certain moving averages are very useful to confirm broad trend directions or reversals. They can help us forecast scenarios based on what has happened to price previously when it interacts with those moving averages.
History doesn't repeat itself, but it does influence the future. Particularly when dealing with assets such as Bitcoin that experience market cycles. Moving averages can act as a useful forecasting tool within that context.
Chart data pre-2012 needs to be interpreted with caution
You may notice some of the chart indicators behave erratically pre 2012.
During this time Bitcoin was in its early price discovery stage. There were a relatively small number of people trading it, trying to ascertain a 'fair' price, which resulted in huge price swings. As a result of this, certain chart indicators move erratically during this period before settling down into consistent patterns as Bitcoin matured post 2012.
Return to Learning Page