Six Readings, No Euphoria.
Oct. 9, 2026
Author: Matt - Director of Research & Analytics
Bitcoin has rallied from the low $80,000s towards $87,000, and even after a pullback we're still making higher highs and higher lows. That's encouraging, but are we getting a little carried away, or is there room for this move to continue?
Across two recent videos, What Happened the Last 5 Times We Saw This and Does the Data Point to More Upside (which I’d definitely recommend checking out both), I've been working through all six components of the Bitcoin Confluence Framework to get a better answer.
In a nutshell:
- The new Bitcoin Confluence Framework is built from six components, each combining multiple inputs into a score out of 100 that we use to read market conditions.
- Structure and Psychology are both fairly neutral, and Flows remains on the more favourable side, so together they don't point to an overheated market.
- Fundamentals and Value have become less favourable after the recovery, while Macro has improved due to liquidity and credit conditions evolving.
Room To Move
The first three components look at Structure, Psychology and Flows. These are contrarian scores, so higher readings indicate more favourable accumulation conditions. A score near 100 is an unusually attractive setup under the model, rather than a promise that price is about to go up.
Structure combines the faster-moving Bitcoin Crosby Ratio with Bitcoin's distance from its 200-Week Moving Average. That lets us look at how stretched the recent move has become alongside the longer-term picture. At the time of writing this article, the score is 45.9, with the Crosby Ratio having cooled out of its overheated region.
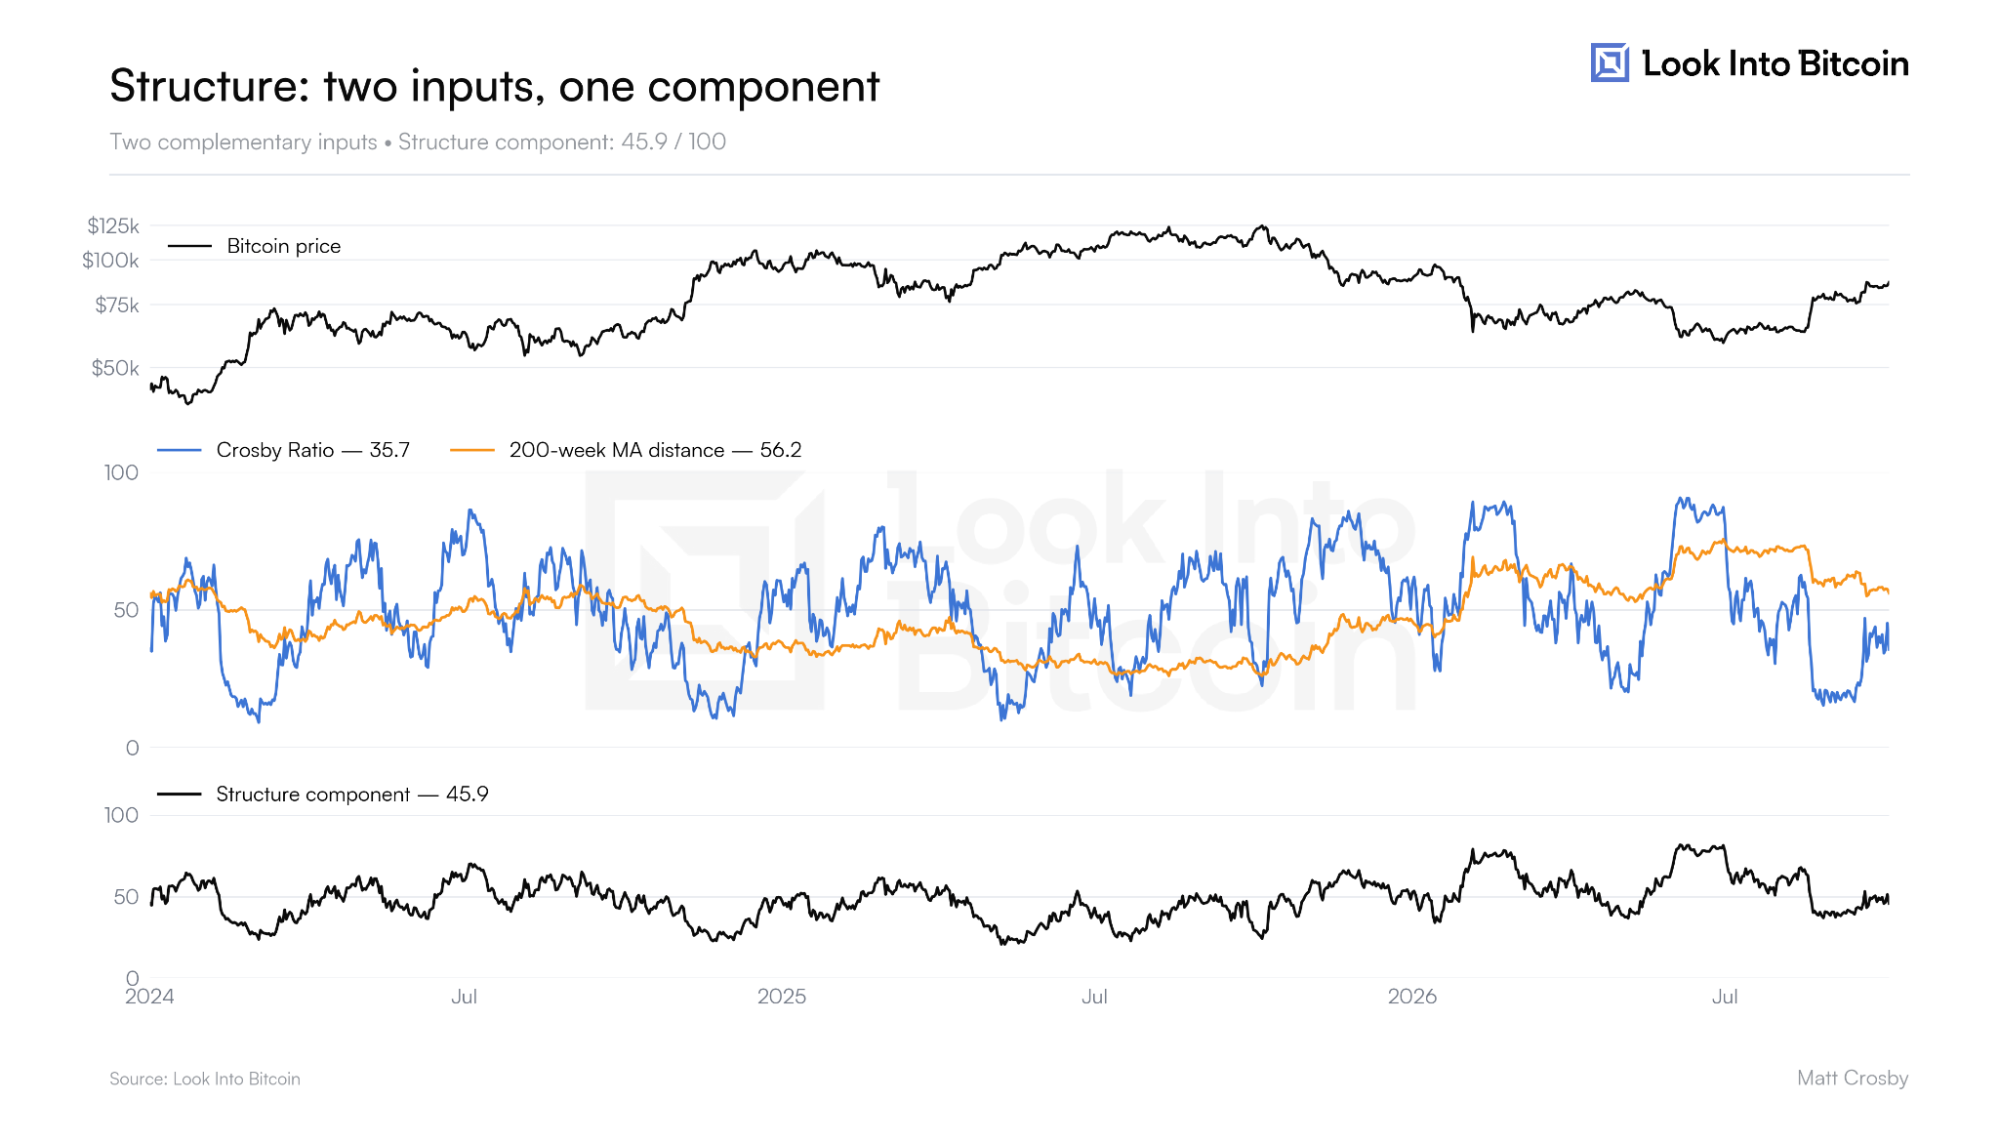
Figure 1: The Structure reading has cooled as Bitcoin continues its recovery.
Psychology tells a similar story. It combines the Bitcoin Fear & Greed Index with a 28-day average of the Spent Output Profit Ratio, so we're looking at both sentiment and the profits or losses people are realising on-chain. At 44.9, it is also fairly neutral, with less profit-taking than earlier in the rally.
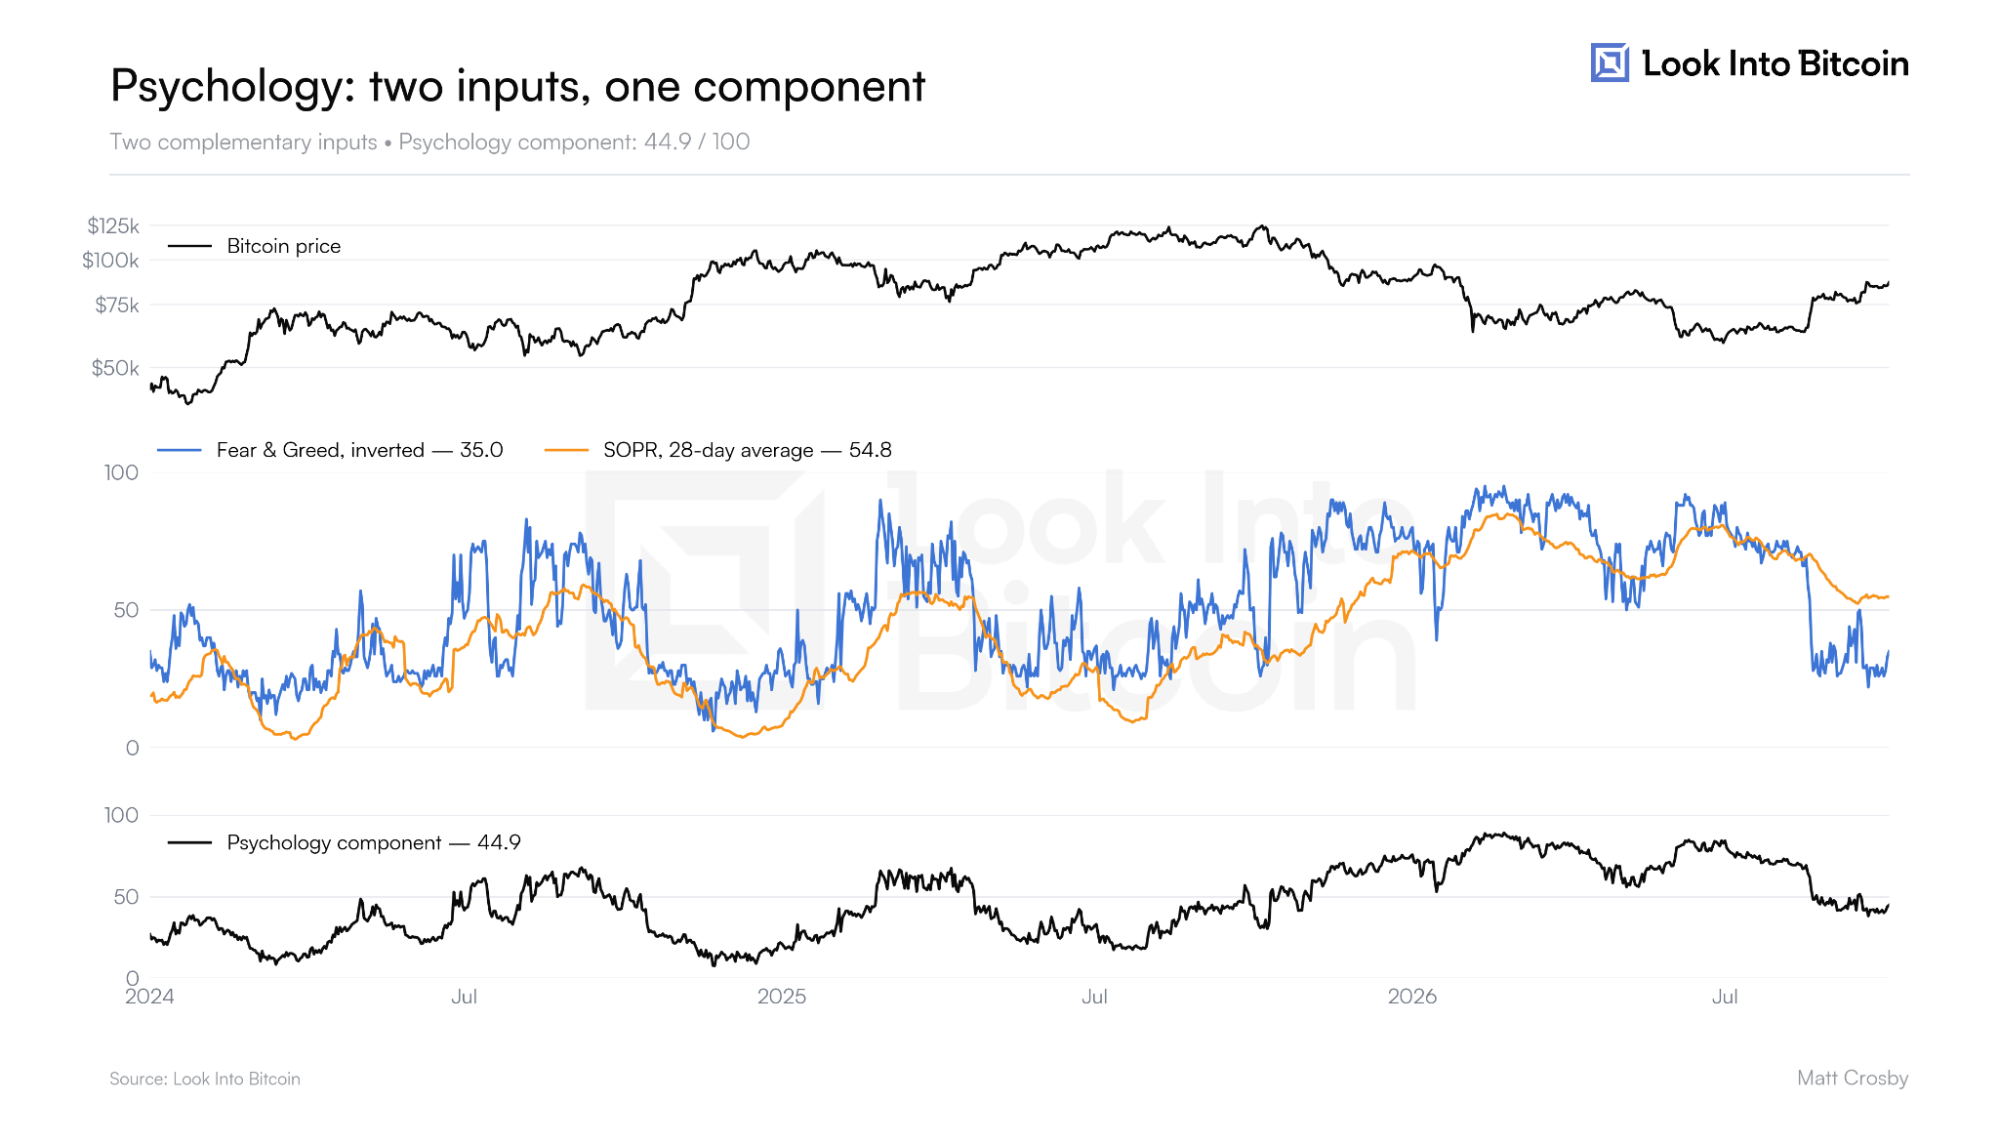
Figure 2: Sentiment and realised profit-taking are not showing broad euphoria.
Flows uses the Value Days Destroyed Multiple and changes in the three-month-plus Realized Cap HODL Waves to follow older-coin activity and how capital is distributed across holding periods. It sits above 50, on the more favourable side of the scale, though it had eased back. Taken together, I wouldn't call the market excessively overheated on these three readings.
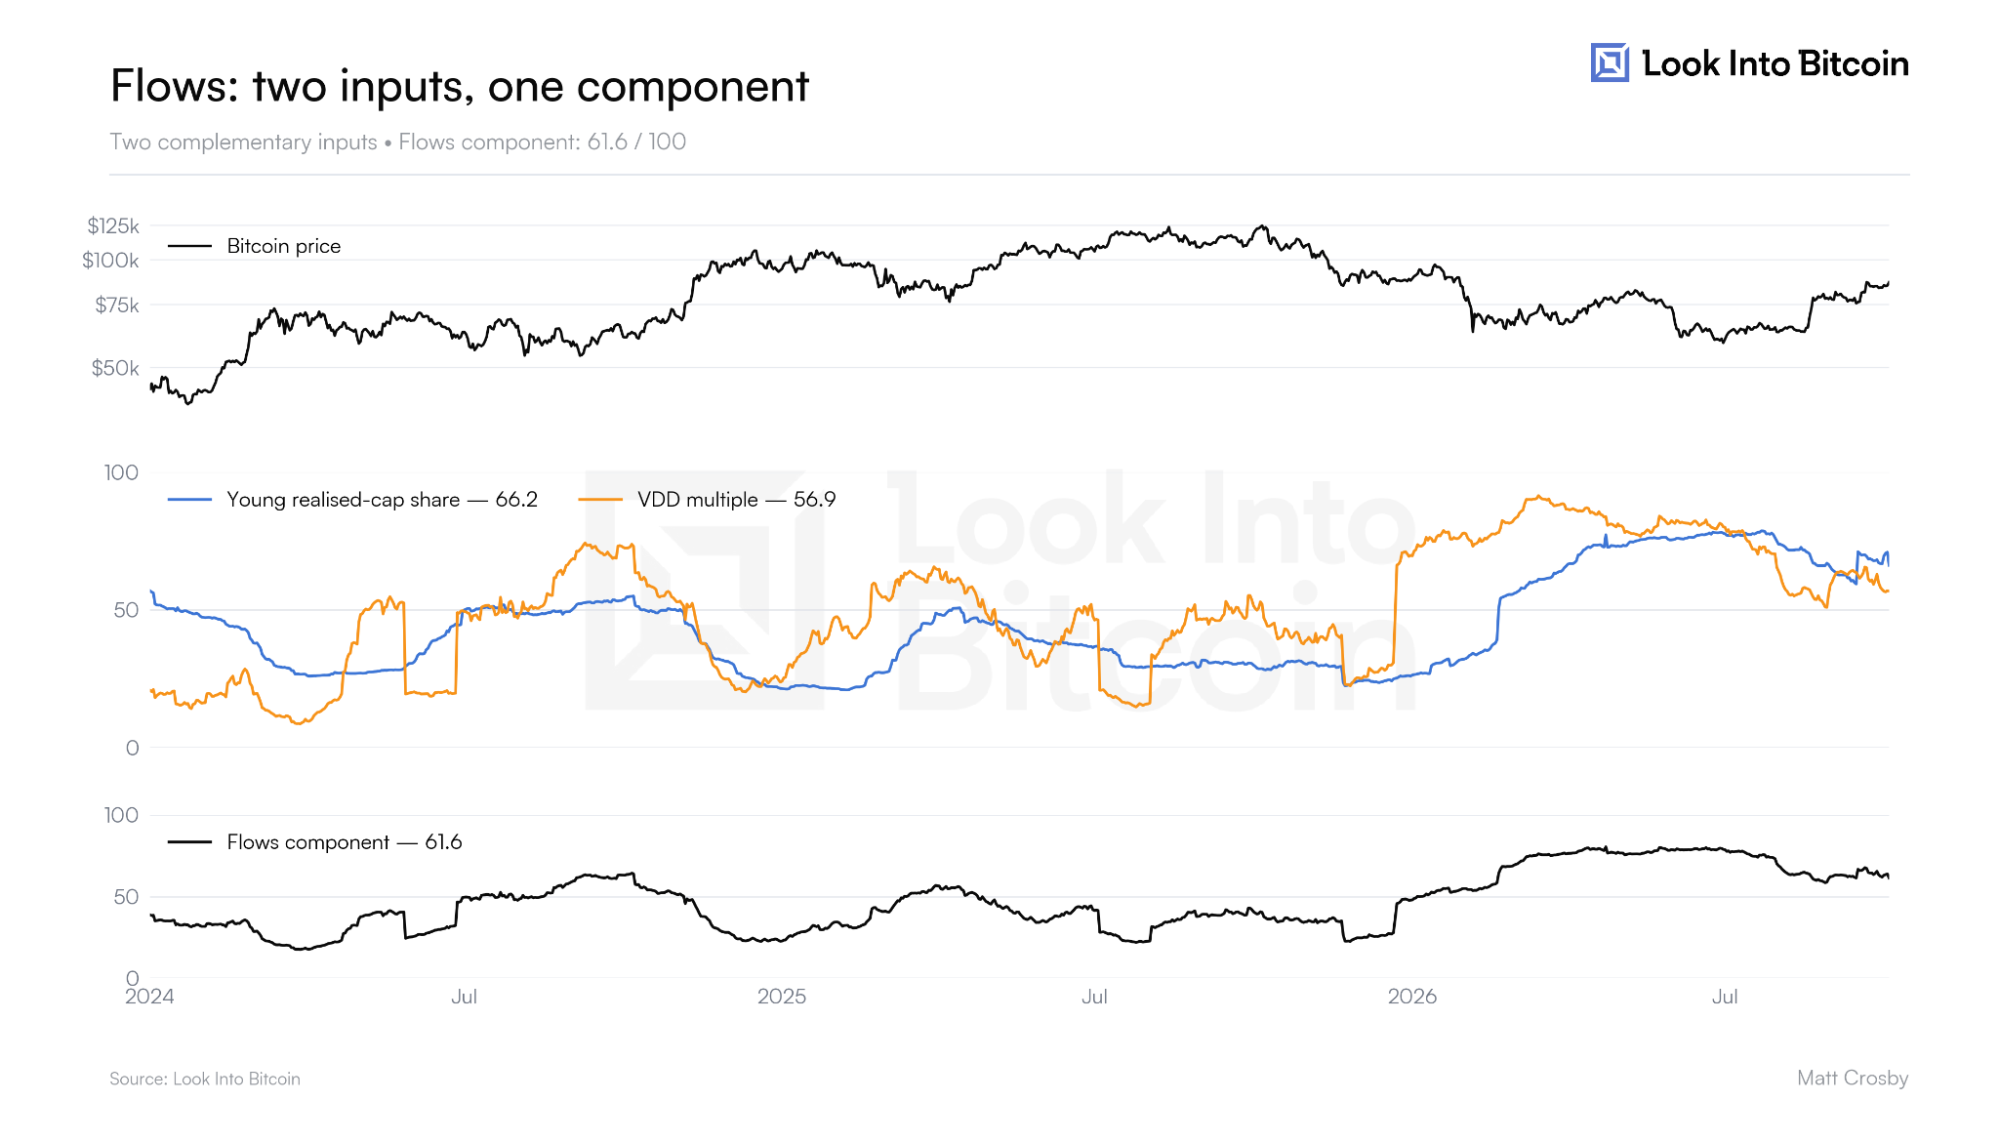
Figure 3: Flows remained on the more favourable side of the framework.
The Bigger Picture
The other three components take us further out. Fundamentals combines the Puell Multiple with the Active Address Sentiment Indicator. We're looking at miner revenue conditions and changes in network activity relative to price, accounting for how those relationships have evolved as Bitcoin has grown.
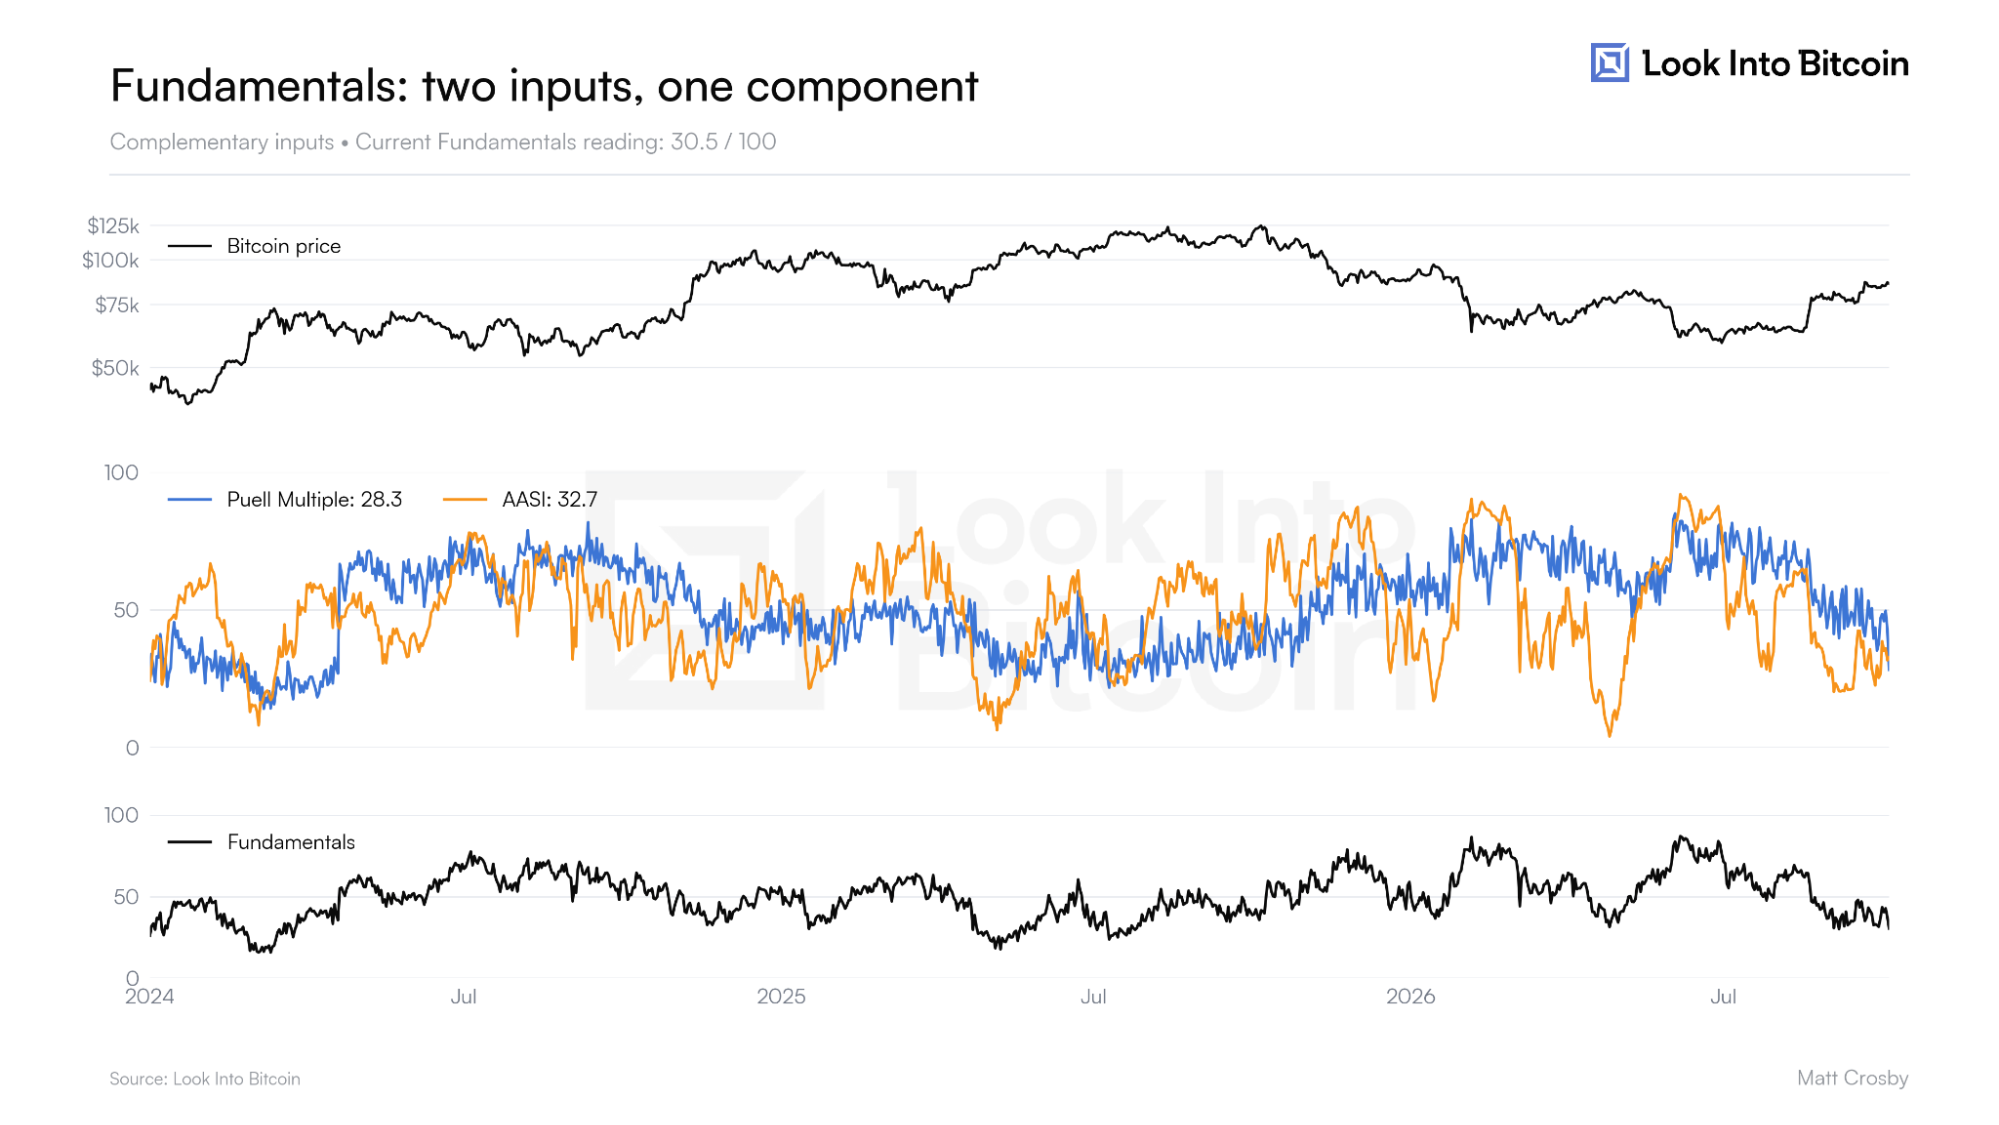
Figure 4: The Fundamentals reading has continued to decline despite Bitcoin’s rally.
Value uses the MVRV Quantile Bands alongside Short-Term Holder MVRV. The point I'd stress here is that Bitcoin doesn't have to revisit the same raw valuation levels every cycle to become cheap. The rising troughs in MVRV helped explain why the recent bear market could offer attractive opportunities without price falling beneath the traditional Realized Price.
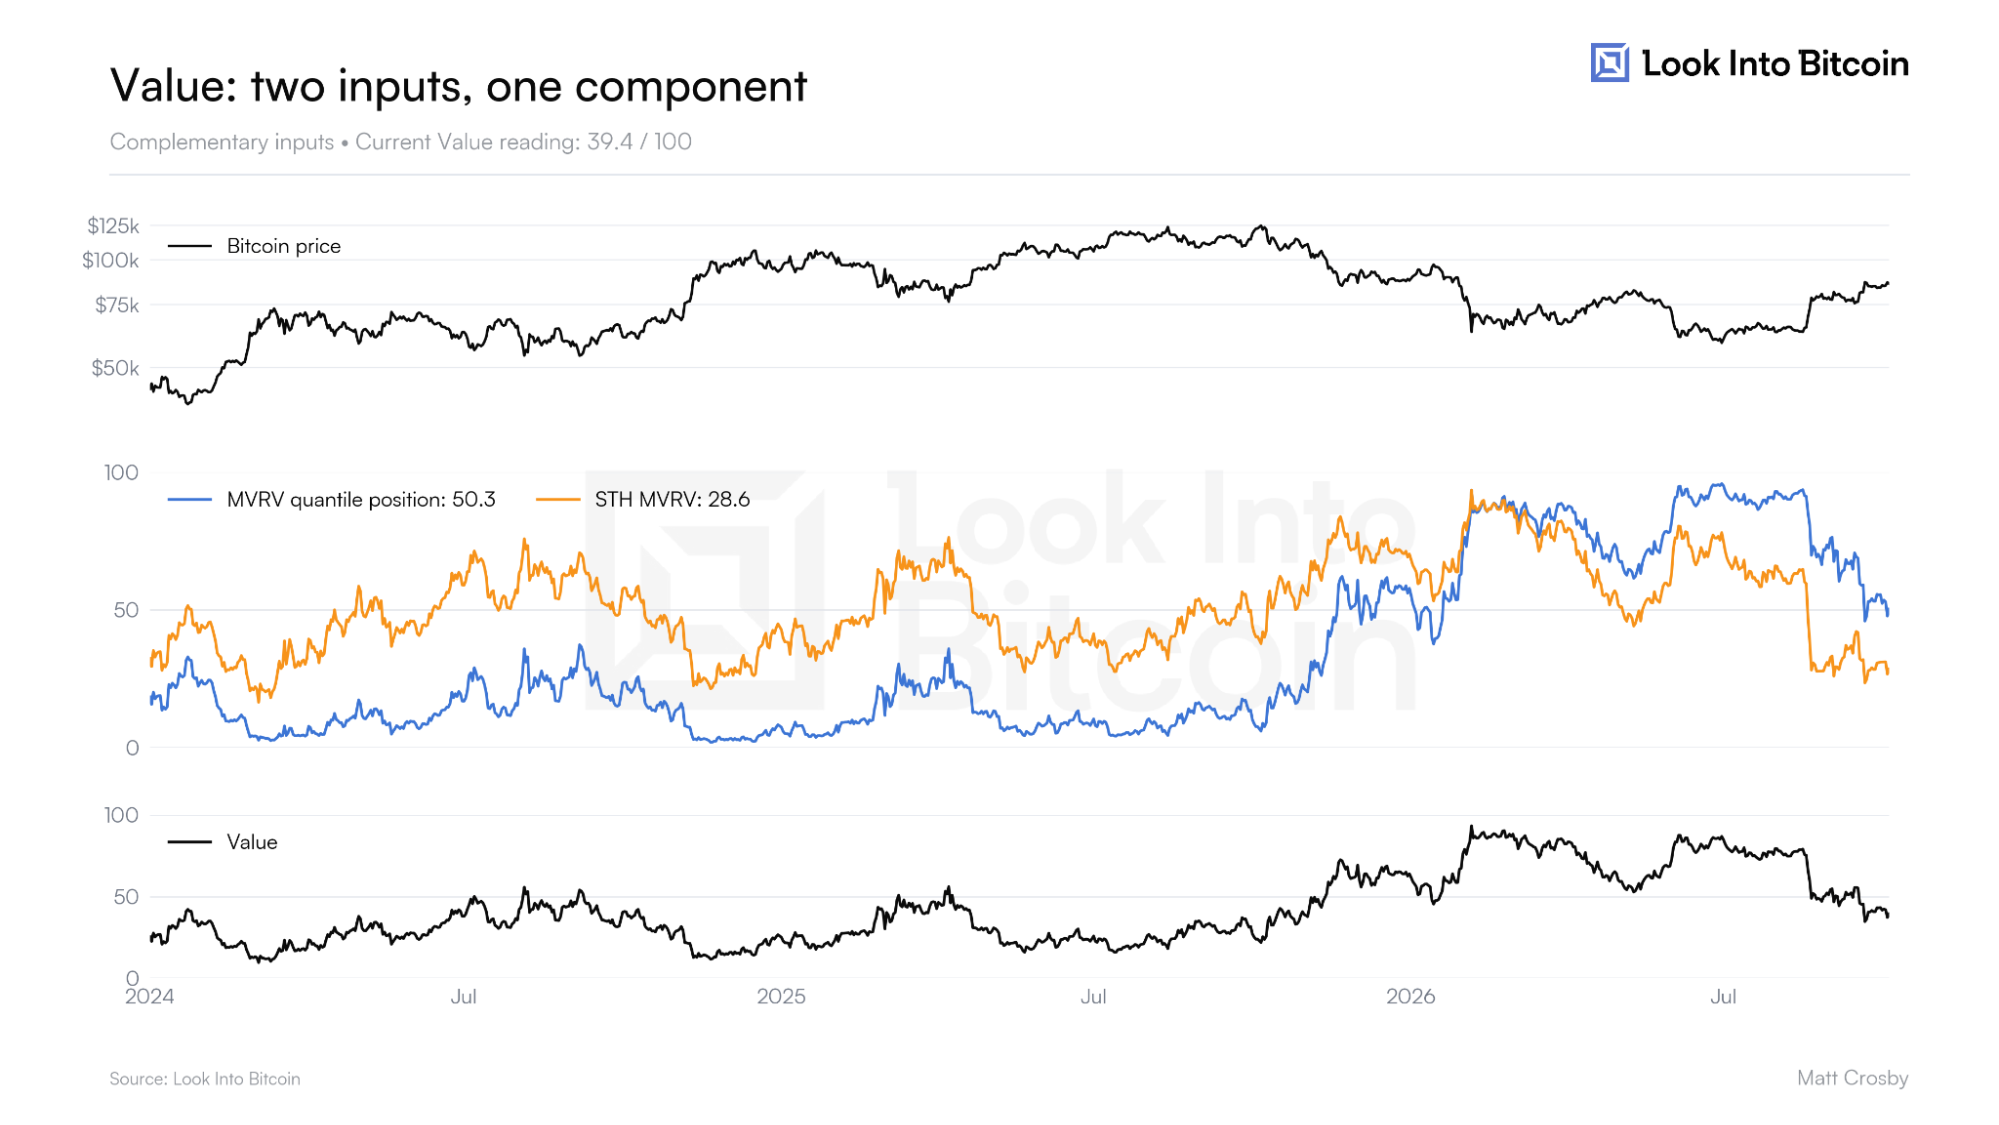
Figure 5: The Value component is also experiencing a less favourable trajectory.
Both had become less favourable after the recovery with Fundamentals at 30.5 and Value at 39.4. Macro, however, has improved and has reached 54.0. This component combines Global M2 liquidity with High-Yield Credit conditions, which gives us a view of the wider environment investors are operating in.
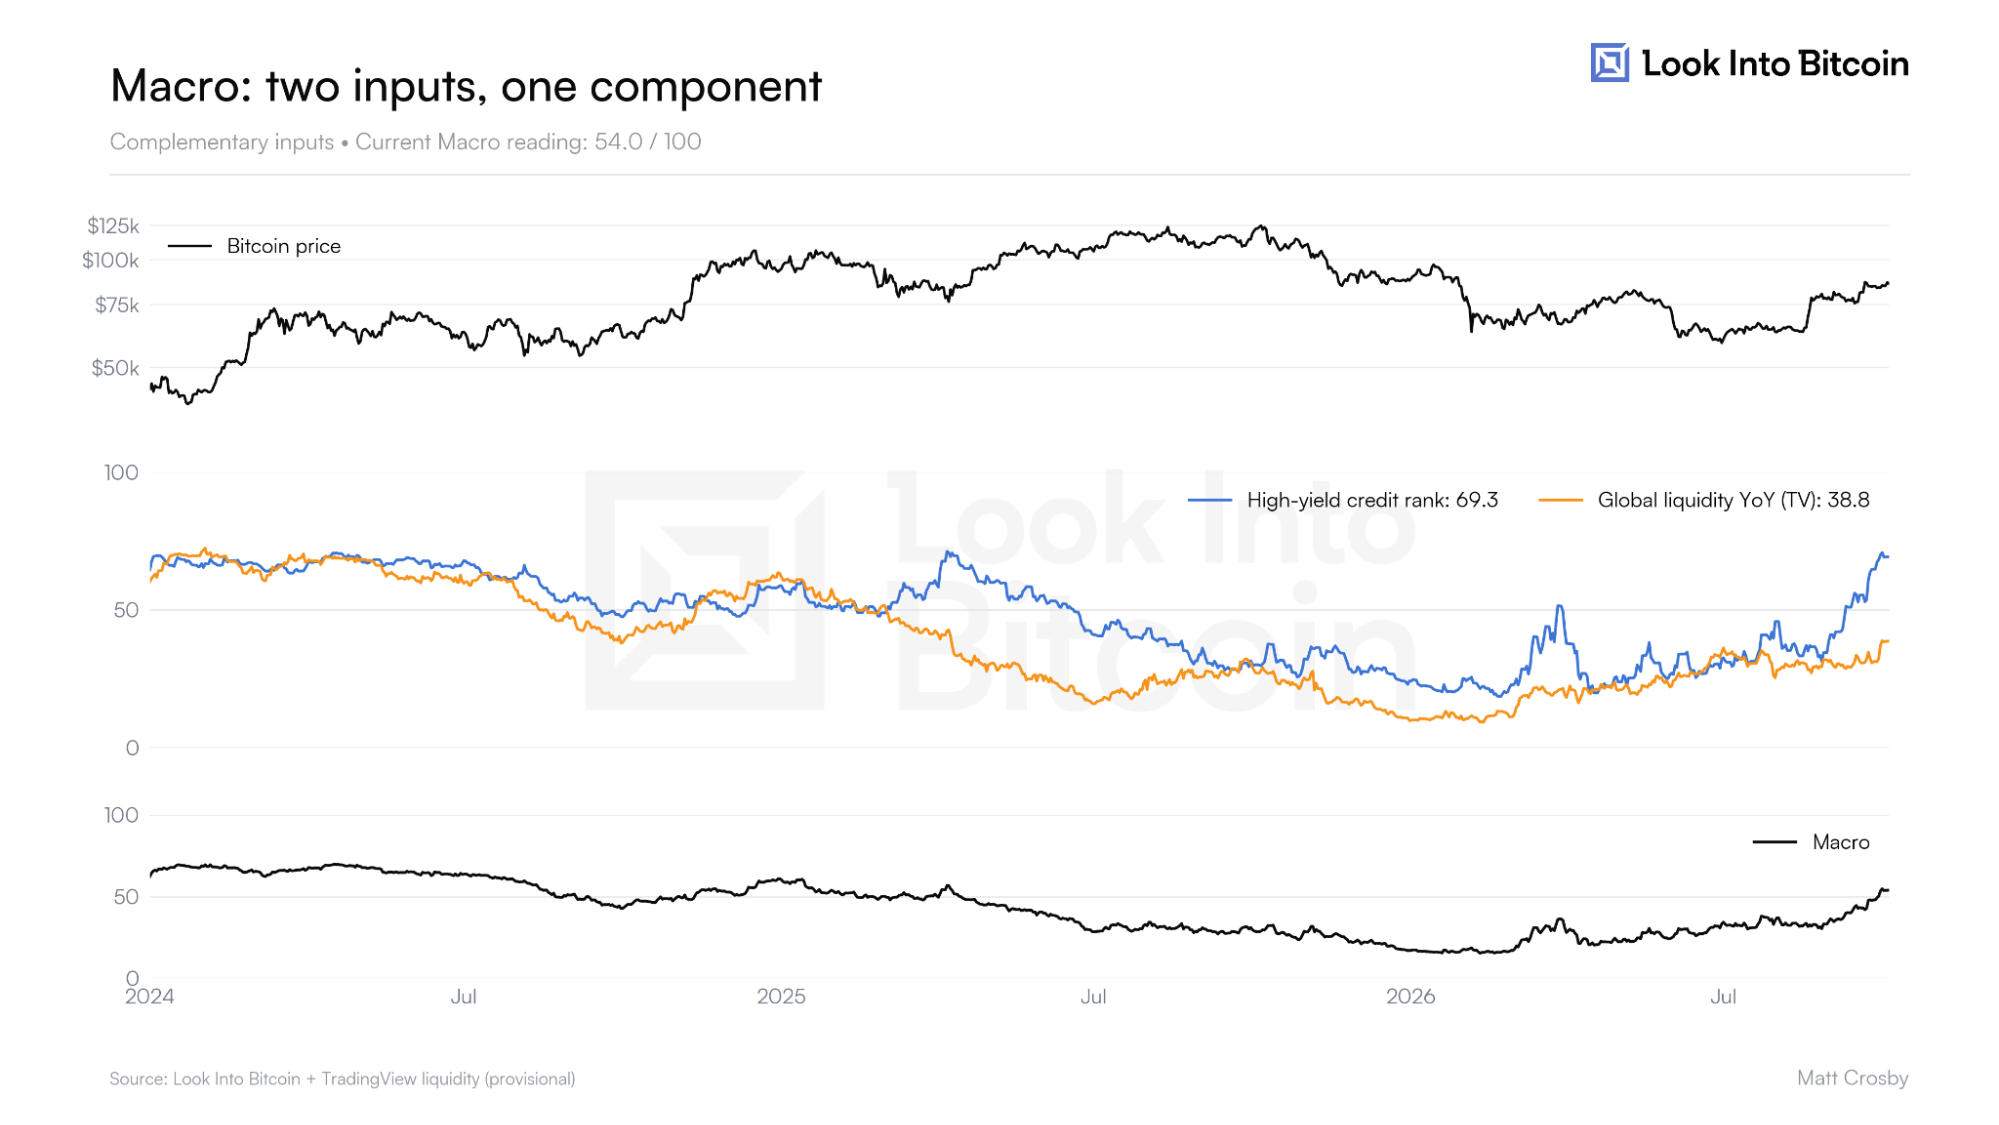
Figure 6: Macro conditions are becoming more favourable since Bitcoin rallied.
So we don't have six components screaming that Bitcoin is cheap. We do have a recovery that has cooled some of its short-term excess while the macro picture has improved. I quite like that combination.
For more on this, watch our recent YouTube video here:
Bitcoin: Does the Data Point to More Upside
Reading The Signals
My read is that this rally still has room to develop. That doesn't rule out more chop or a deeper pullback, but the data isn't showing the sort of across-the-board excess that would make me think the move has already exhausted itself.
We'll keep refining the framework and testing what deserves its place. For now, it's giving us a clearer way to follow the recovery without having to decide that one indicator, or one historical comparison, has all the answers.
Have a lovely week, and I'll see you in the next one!
Research Director
Any information on this site is not to be considered as financial advice. Please review the Disclaimer section for more information.