Is Midterm Q4 Really The Best Time To Buy Bitcoin?
Oct. 16, 2026
Author: Matt - Director of Research & Analytics
We’ve now entered Q4 of a midterm year, which supposedly is the absolute best time to accumulate Bitcoin and worth waiting specifically for. You’ve probably heard some version of that argument on social media or YouTube, but does the data actually support it?
I wanted to run the numbers myself. We looked at every quarter of the presidential cycle across Bitcoin’s available history, then ran the same analysis on the S&P 500 and gold for confluence. At first glance, the results look fairly convincing. But once we dig into where those returns came from and how the pattern has changed over time, I think there are good reasons to question how much weight it deserves today.
In brief:
- Buying at the start of midterm Q4 has produced the best average 12-month return for Bitcoin (over 2,000%) and the S&P 500 (18.5%), though not for gold.
- Bitcoin’s average rests on just four observations, and the 2010 purchase, up roughly 8,021%, accounts for almost all of it.
- Switch to three monthly buys and median returns, and midterm Q4 loses its top spot: Bitcoin’s 51% trails 10 out of 16 quarters.
The Case
On the face of it, the case looks strong. If we measure the average 12-month return from buying at the start of each quarter, midterm Q4 comes out on top for both Bitcoin and the S&P 500. Bitcoin’s average return is over 2,000%, while the S&P’s is 18.5%. Those are impressive numbers. If we stopped there, it would be easy to conclude that this is exactly when we should be buying.
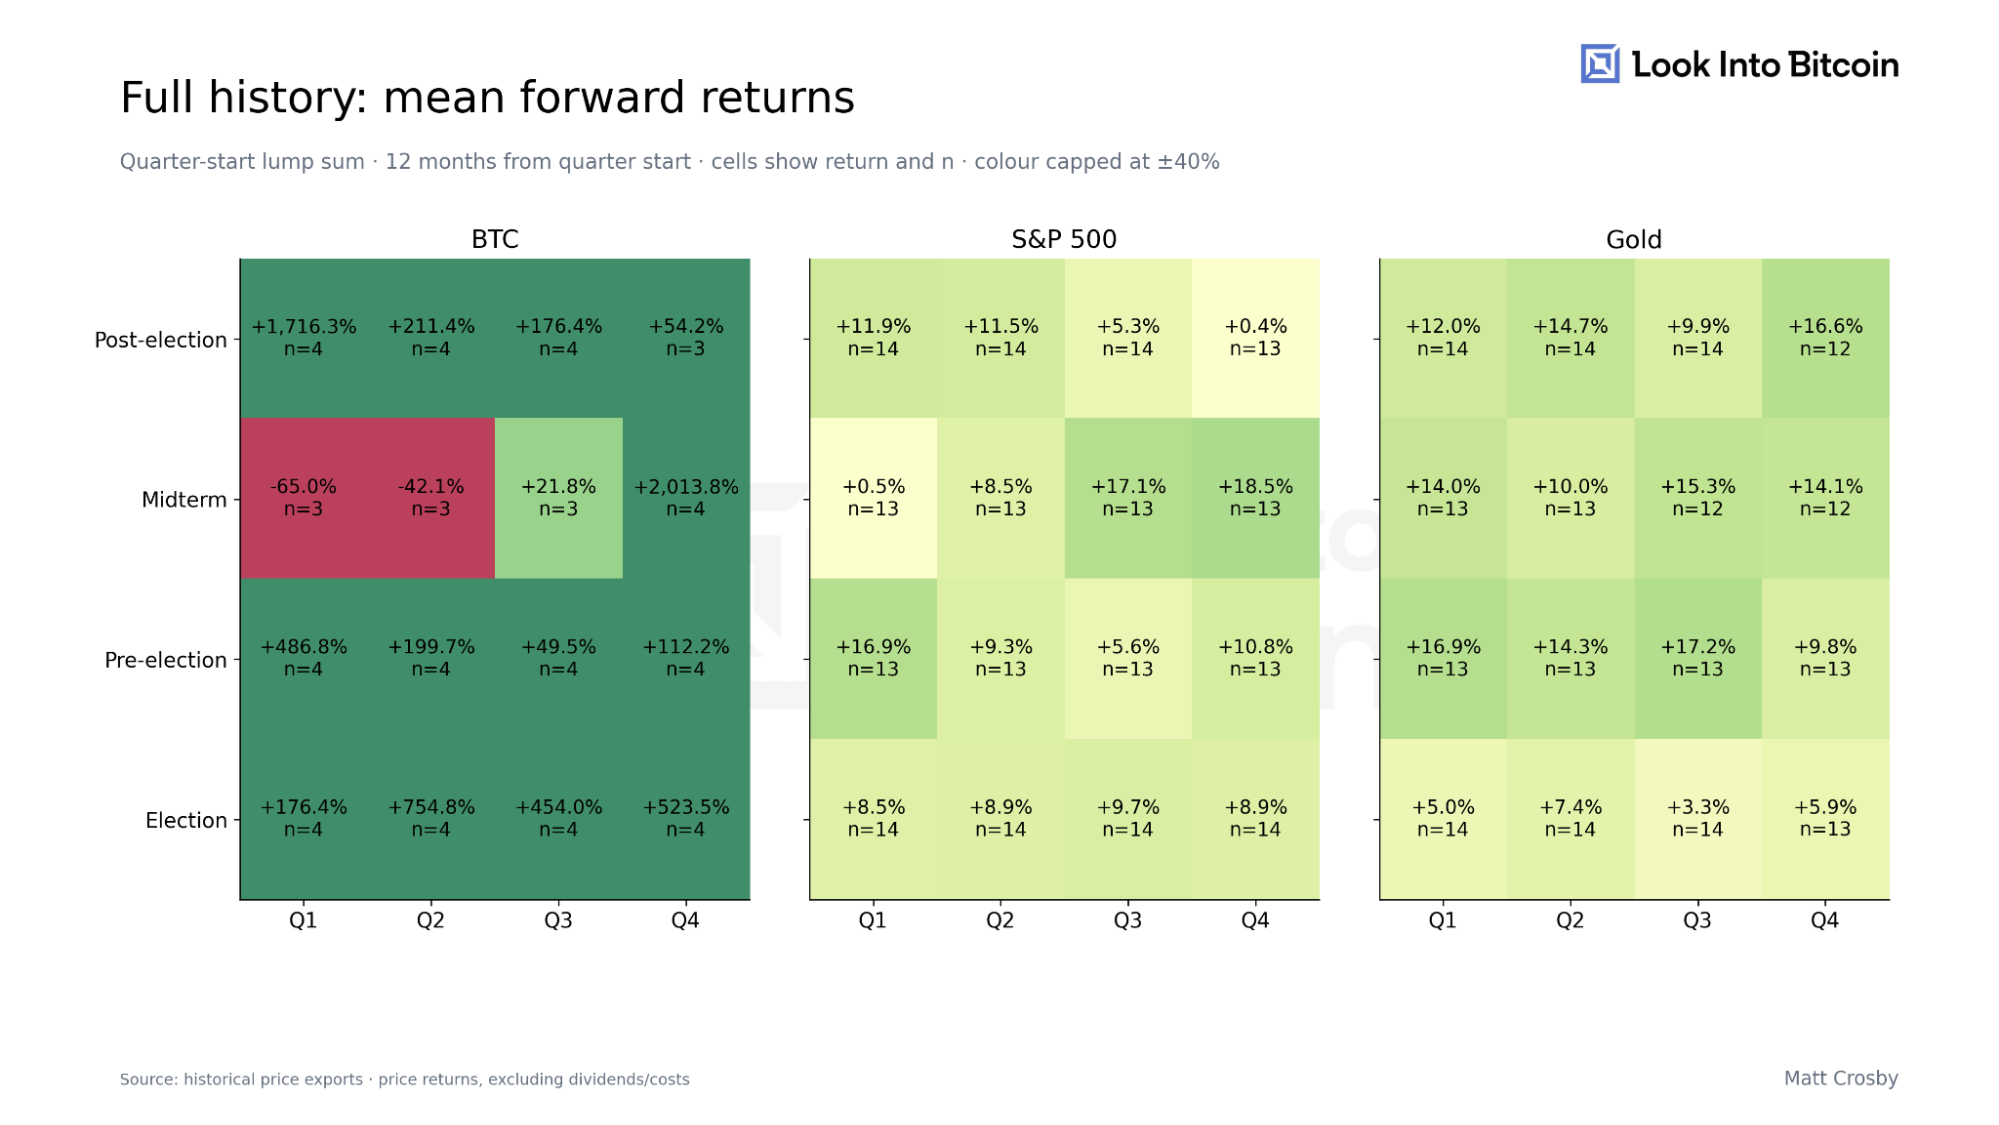
Figure 1: Mean 12-month returns from a quarter-start buy, by presidential-cycle quarter.
The S&P gives us a much longer history to work with, and understanding whether this has been a useful period for equity investors could also help put the Bitcoin argument into context. The first thing we need to check, though, is what’s actually driving those averages.
One Bitcoin Observation
Bitcoin has only four completed midterm-Q4 observations in this sample: 2010, 2014, 2018 and 2022. Buying at the start of Q4 2010 produced a return of roughly 8,021% over the following 12 months, while the other three outcomes were −37.8%, +27.2% and +44.9%. That single early observation accounts for almost all of the extraordinary average we just saw.
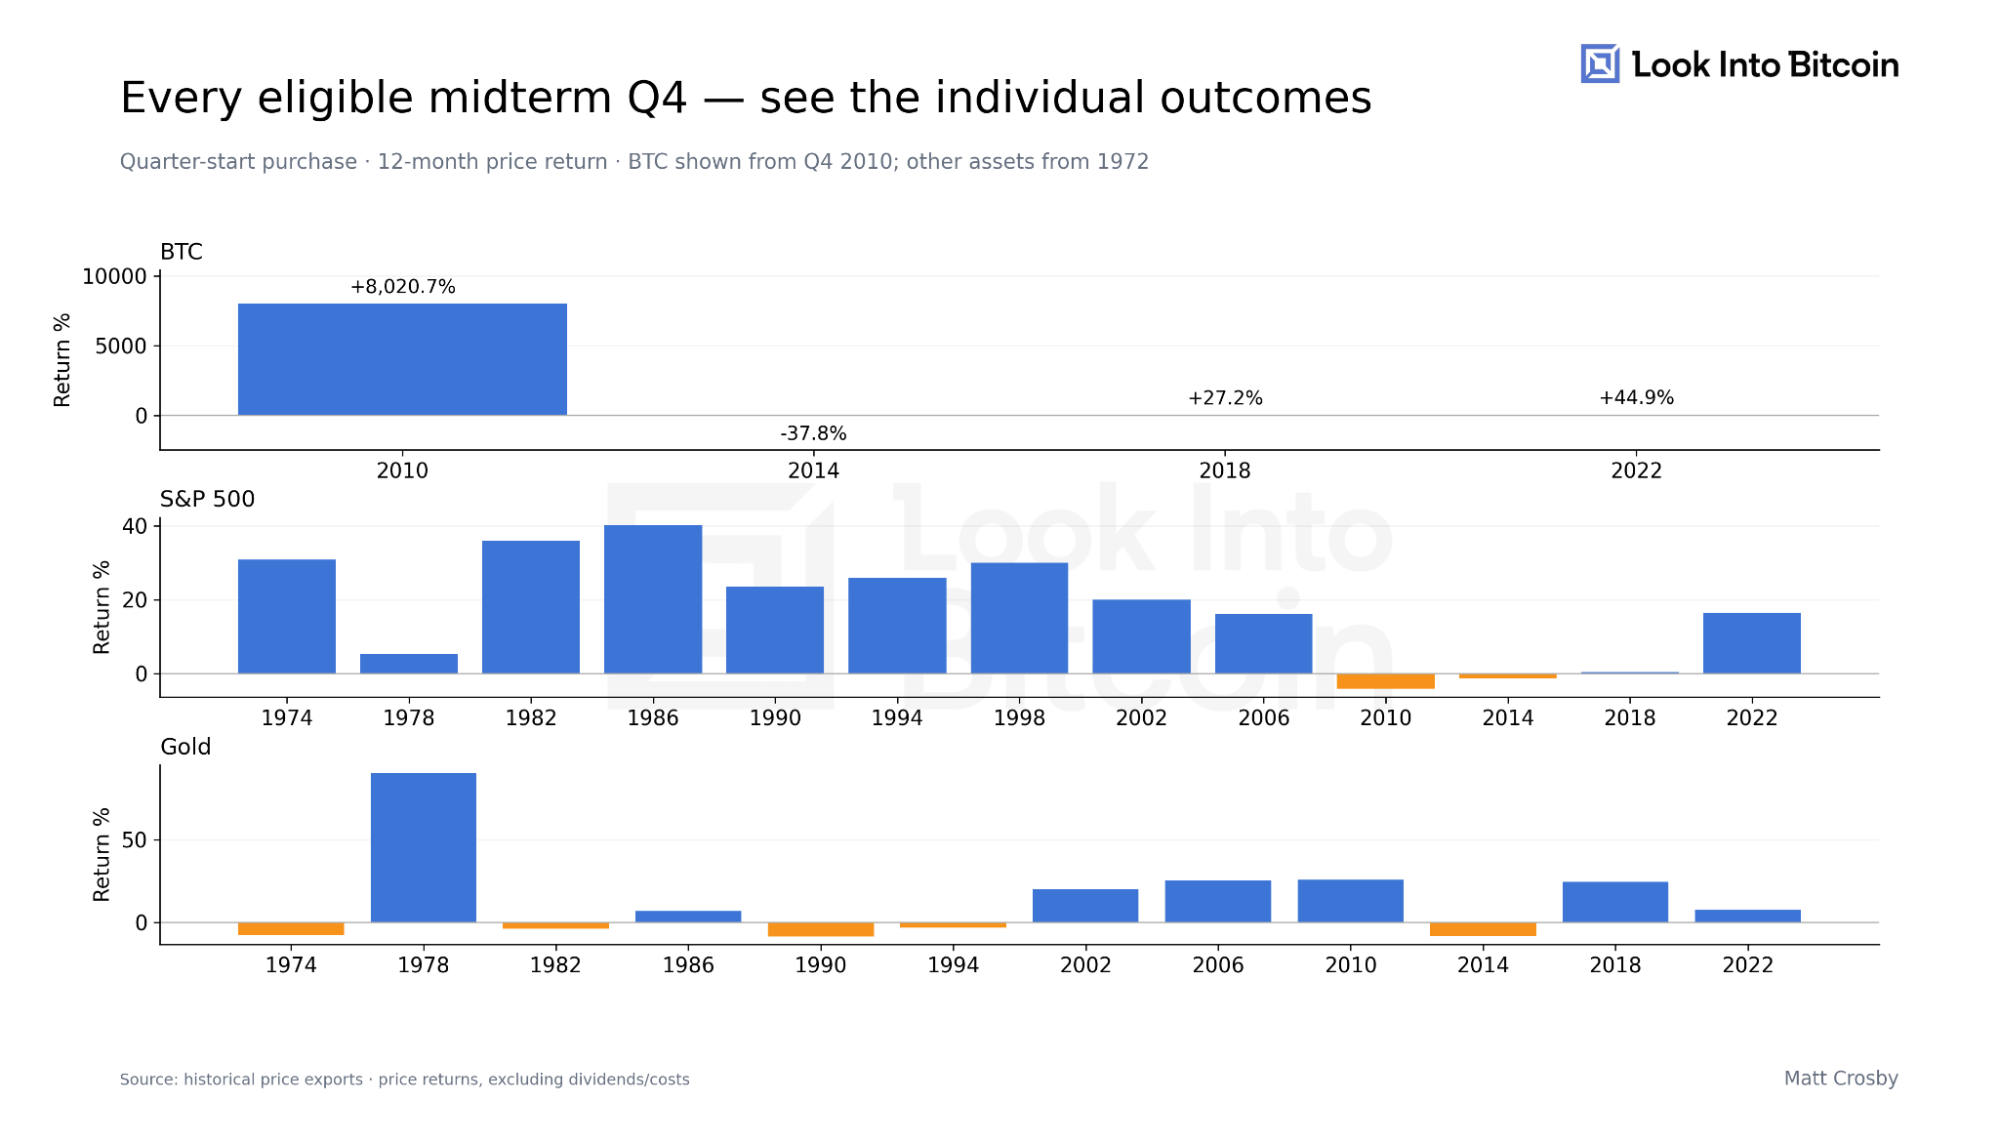
Figure 2: 12-month returns from every midterm Q4 buy for Bitcoin, the S&P 500 and gold.
I’m not suggesting we delete 2010 because it makes the results inconvenient. It happened, and it belongs in the history, but with only four observations we need to recognise how much influence it has. Bitcoin was a very different market in 2010, so an average above 2,000% tells us very little about what a typical outcome looks like today.
Most people talking about accumulating during Q4 aren’t suggesting putting everything in on the first day of October. To reflect that, we also tested three equal purchases, one at the start of each month within the quarter, and measured their value 12 months after the quarter began. That reduces the dependence on any single entry date, and using the median result limits the influence of an exceptionally large return like Bitcoin’s in 2010.
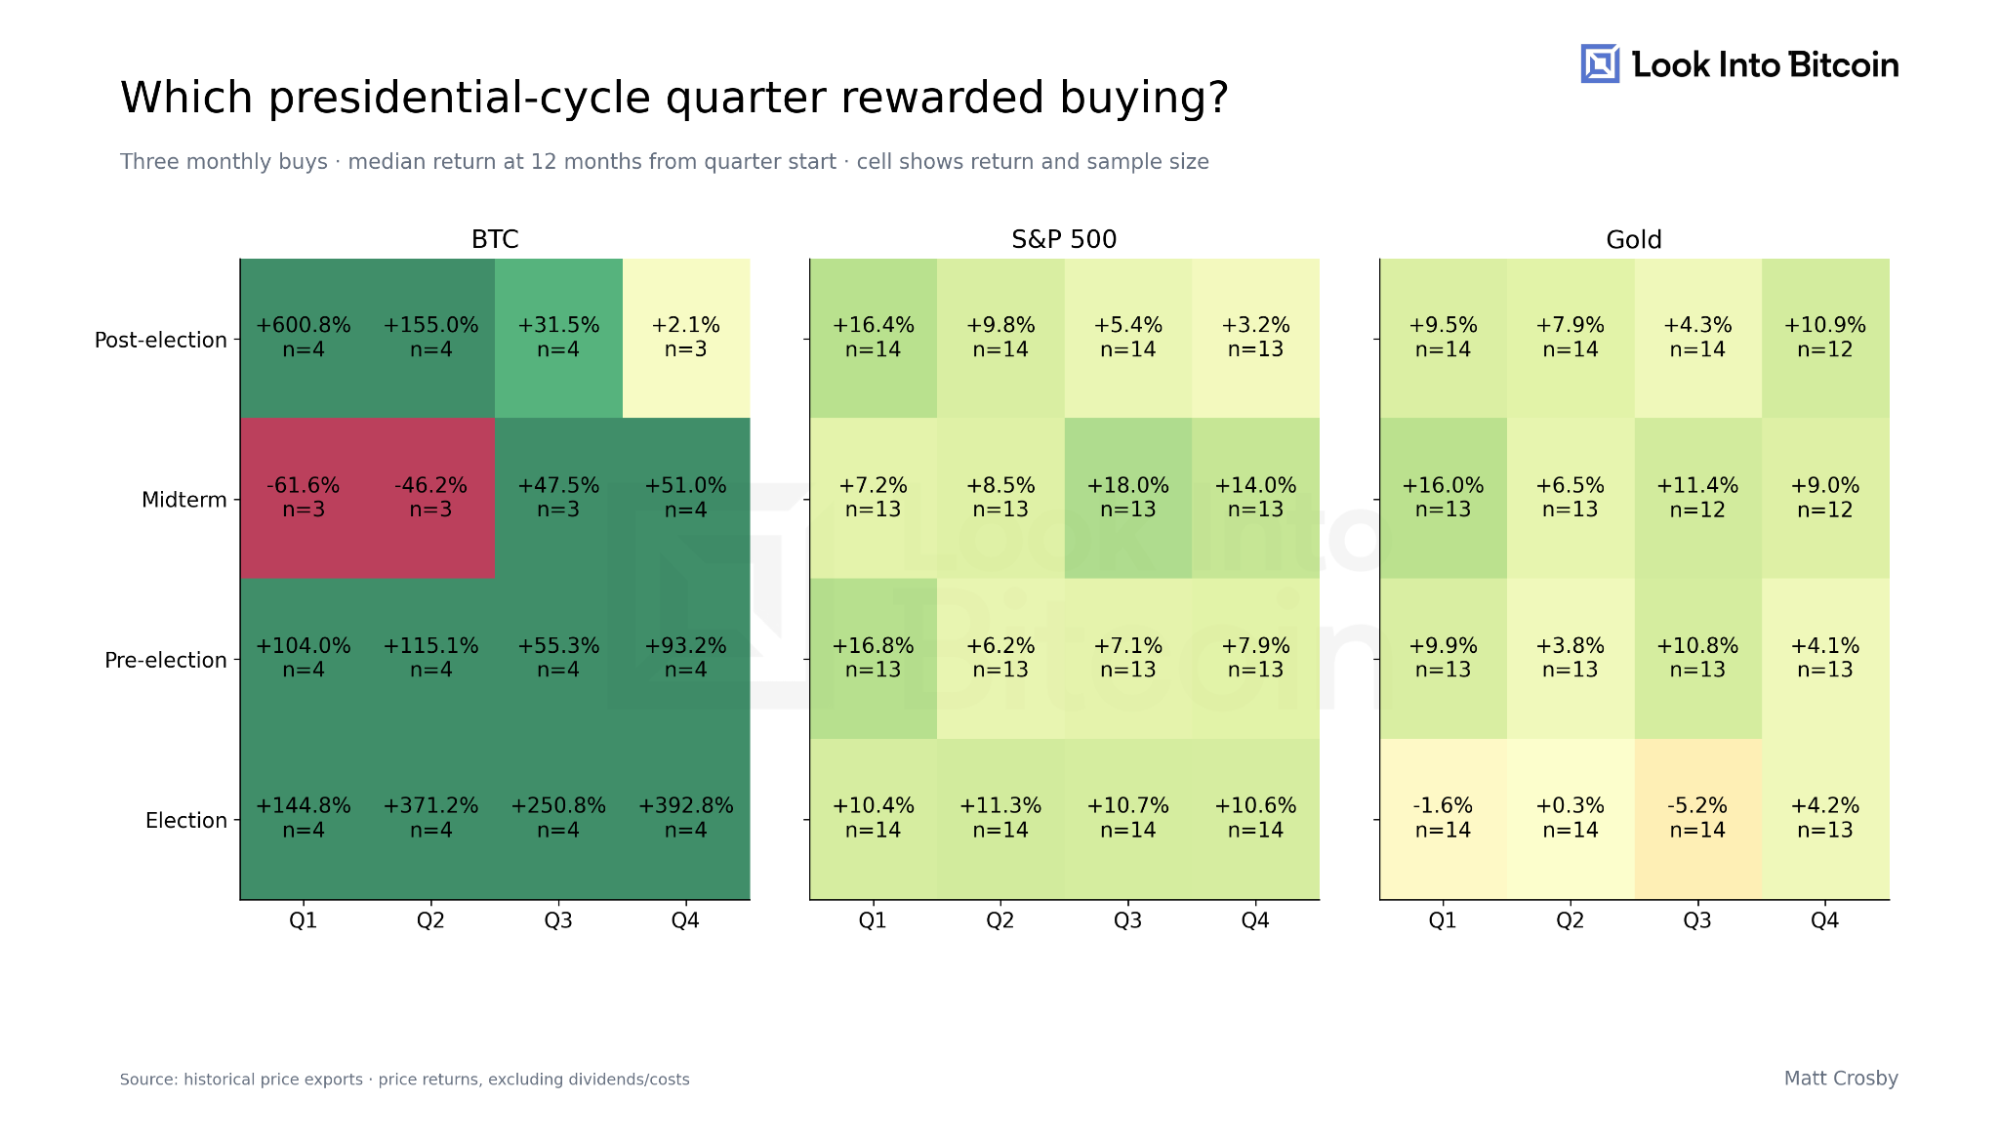
Figure 3: Median 12-month returns from three monthly buys, by presidential-cycle quarter.
Bitcoin’s midterm-Q4 median return is still a substantial 51%, but plenty of other quarters performed better. That distinction matters, because a period can produce positive returns without being an unusually good time to buy. If the claim is that we should specifically favour midterm Q4, we need to compare it with the alternatives.
For the S&P, the median return from averaging into midterm Q4 is around 14%. That’s a good result, but three other quarters rank higher, and gold’s roughly 9% result is similarly unremarkable within its own history. We’ve gone from midterm Q4 looking like the obvious winner to a much more mixed picture simply by changing from a single purchase and average returns to monthly accumulation and median returns. Even if you didn’t sell after 12 months and held until today, looking at the median all-time holding returns, there are 10 out of 16 months that outperformed this quarter.
Has The Advantage Survived?
There’s another issue with using a long historical average, in that it can hide a change in behaviour. A pattern that worked well in the 1970s and 1980s might still look attractive across the full dataset, even if it hasn’t helped investors in more recent cycles. To check that, we compared each midterm-Q4 outcome with the median outcome from the other quarters in the same complete presidential cycle, then grouped those differences into historical periods. A positive reading means midterm Q4 outperformed that within-cycle benchmark, and a negative reading means it underperformed.
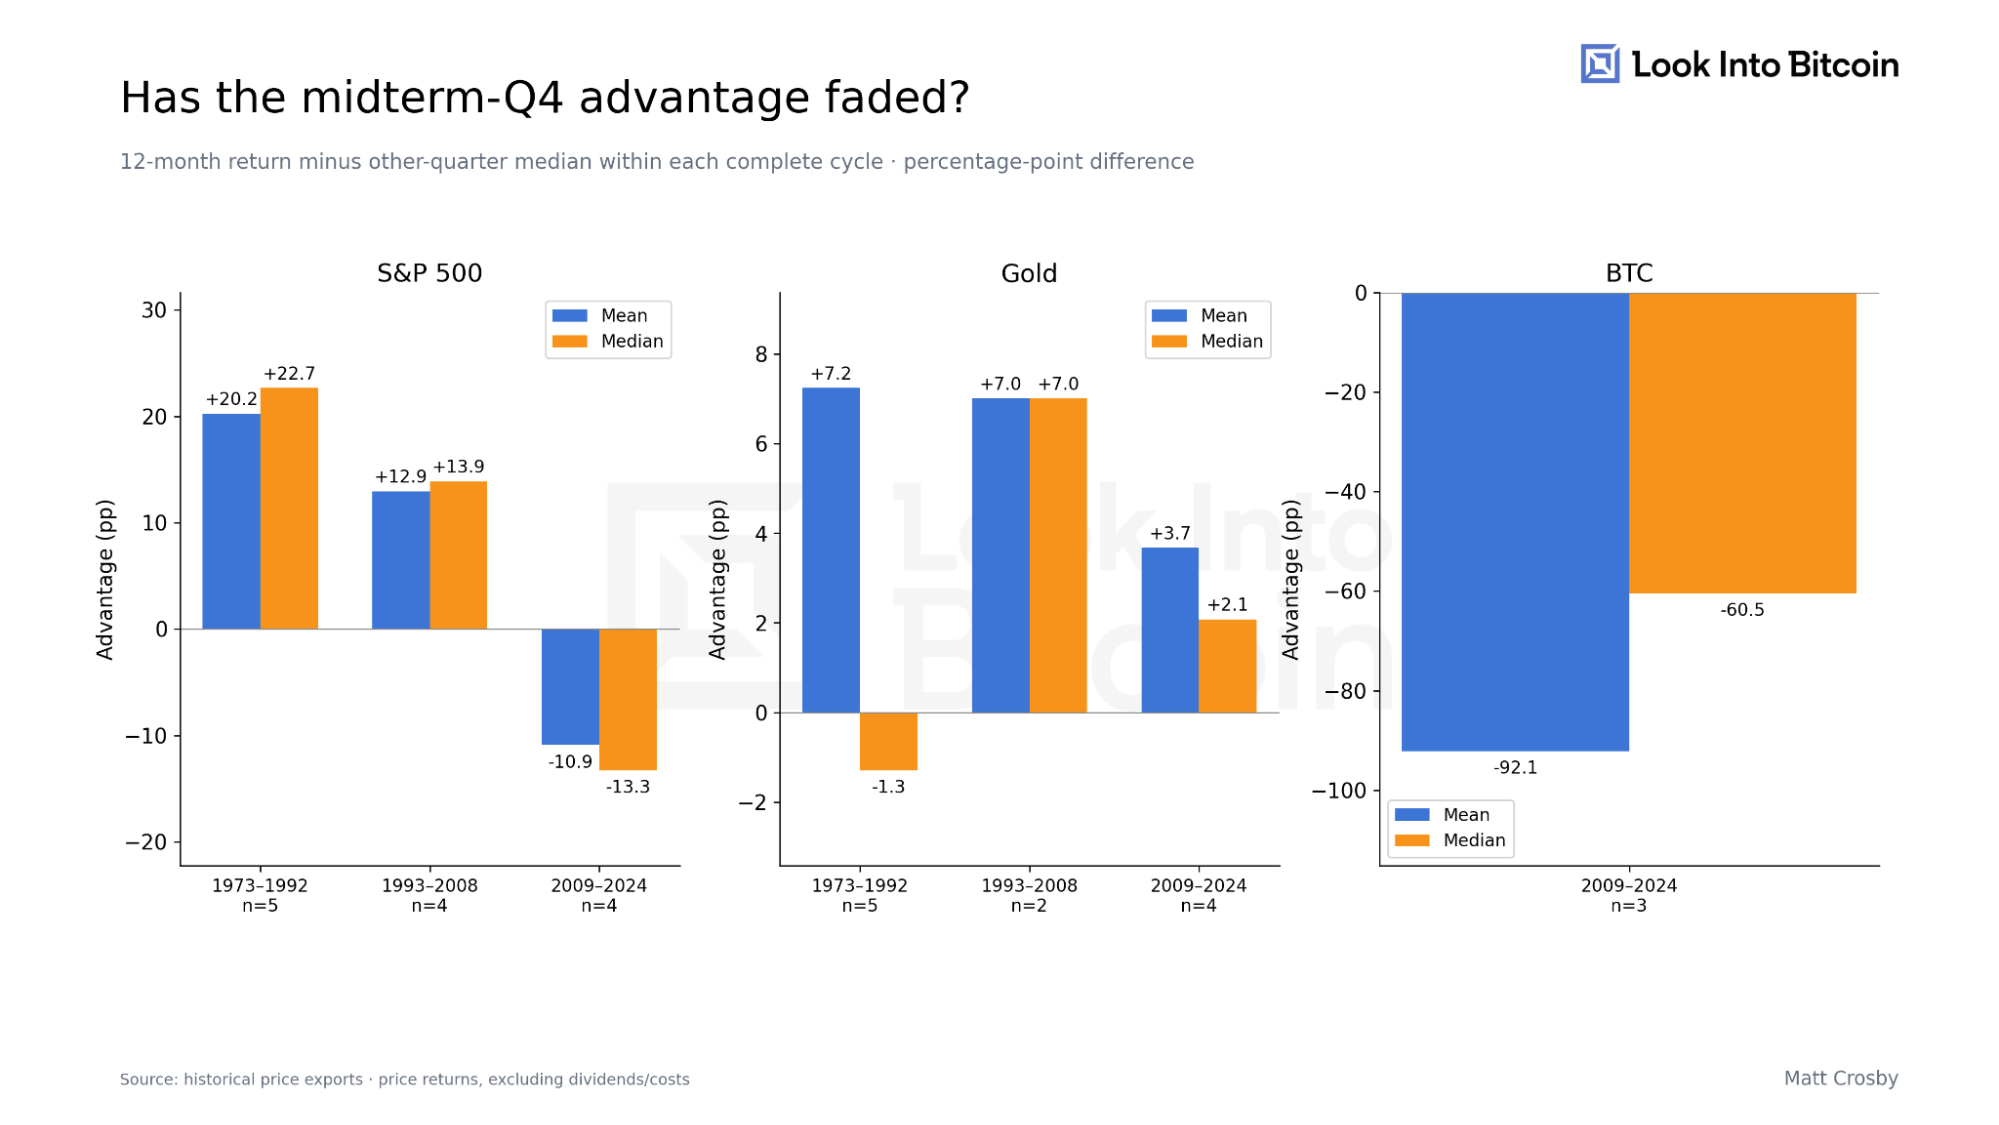
Figure 4: Midterm Q4 return minus the other-quarter median, grouped by historical era.
For the S&P, there was a clear advantage in the earliest period, 1973 to 1992. It was smaller from 1993 to 2008 and negative across the 2009 to 2024 cycles. Gold is less consistent and doesn’t give us a clear, repeatable midterm-Q4 preference across the periods.
The Individual Cycles
Grouping the results into eras is useful, but I also wanted to see the individual observations behind that change. The next chart shows the S&P’s midterm-Q4 advantage using the three-month accumulation approach. Each point compares its 12-month outcome with the median outcome from the other quarters in that same cycle, although the exact same results occur if you test over a 6 or 3 month lookahead.
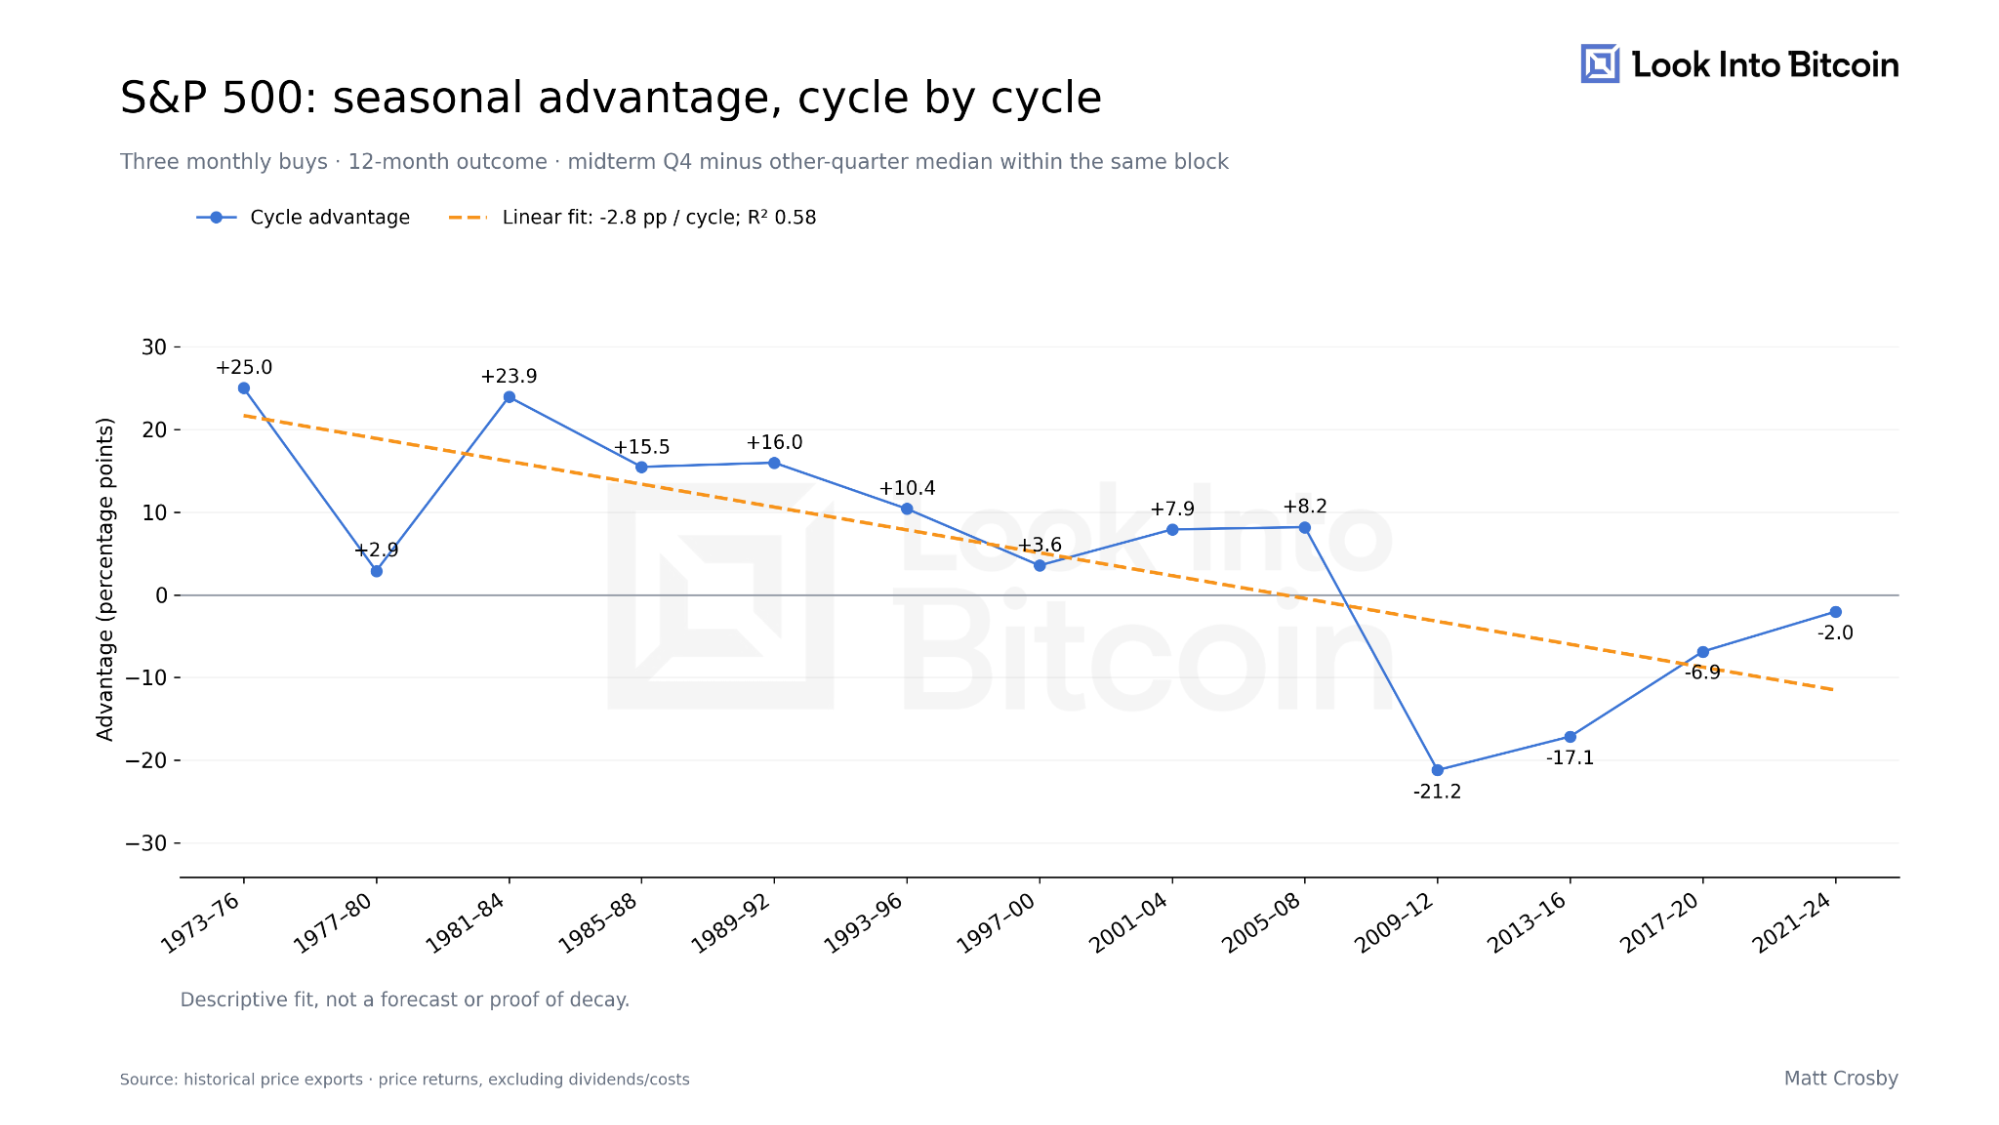
Figure 5: S&P accumulation advantage, cycle by cycle.
The earlier cycles are mostly positive. The latest four complete cycles are all negative, although the size of that underperformance varies considerably. The fitted line helps illustrate the direction of the historical results, but it doesn’t prove that the advantage must keep declining, and it isn’t a forecast for this year. Either way, the recent observations don’t support the same conclusion as the full-history average. If I were relying on this seasonal pattern to decide when to deploy capital, I’d be questioning whether it still deserves the same weight.
What Does That Mean For Bitcoin?
Am I saying we shouldn’t be accumulating Bitcoin during this quarter? No. There may be perfectly good reasons to buy now, and price, valuation, investor behaviour, capital flows and the broader market environment can all support that decision. What I’m questioning is whether “it’s Q4 of a midterm year” adds enough on its own to justify it.
Bitcoin’s sample is tiny, its average is dominated by one early result, and the stronger equity-market history looks less compelling when we focus on recent cycles. That isn’t a particularly solid foundation for treating this quarter as an automatic buying opportunity.
For me, the data doesn’t justify giving midterm Q4 special status. I’m happy to accumulate when the opportunity looks attractive, but I’d rather judge that by assessing on-chain activity, derivatives positioning, investor sentiment, liquidity and the underlying network together than assume the calendar has already given us the answer.
For more on this, watch our recent YouTube video here:
Bitcoin: I Tested the “Best Time to Buy”
Have a lovely week, and I’ll see you in the next one!
Research Director
Any information on this site is not to be considered as financial advice. Please review the Disclaimer section for more information.