Bitcoin Is Quiet. But For How Much Longer?
Oct. 20, 2026
Author: Matt — Director of Research & Analytics
Bitcoin hasn’t been doing a great deal lately. Since the breakout in mid-August, we’ve spent around two months moving sideways, giving back very little of the roughly 50% rally from the lows. That might feel frustrating if you’re waiting for the next move. It’s doubly so if, like me, you’ve been hunting for a decent dip to buy!
But beneath that quiet price action, the market has been cooling down. The question is whether this is setting up another move higher or whether we should be preparing for a deeper correction.
In a nutshell:
- One-month volatility is lower than around 82% of readings over the past four years.
- The Crosby Ratio has cooled from its overheated region back to neutral.
- Just under 64% of supply hasn’t moved for at least a year, so a growing share of coins has stayed put through the recovery.
Volatility Compressed
Bitcoin’s shorter-term volatility readings have been declining across the one-week, two-week and one-month measures. The one-month reading is now lower than around 82% of observations over the past four years. It’s relatively unusual for Bitcoin to be this quiet.
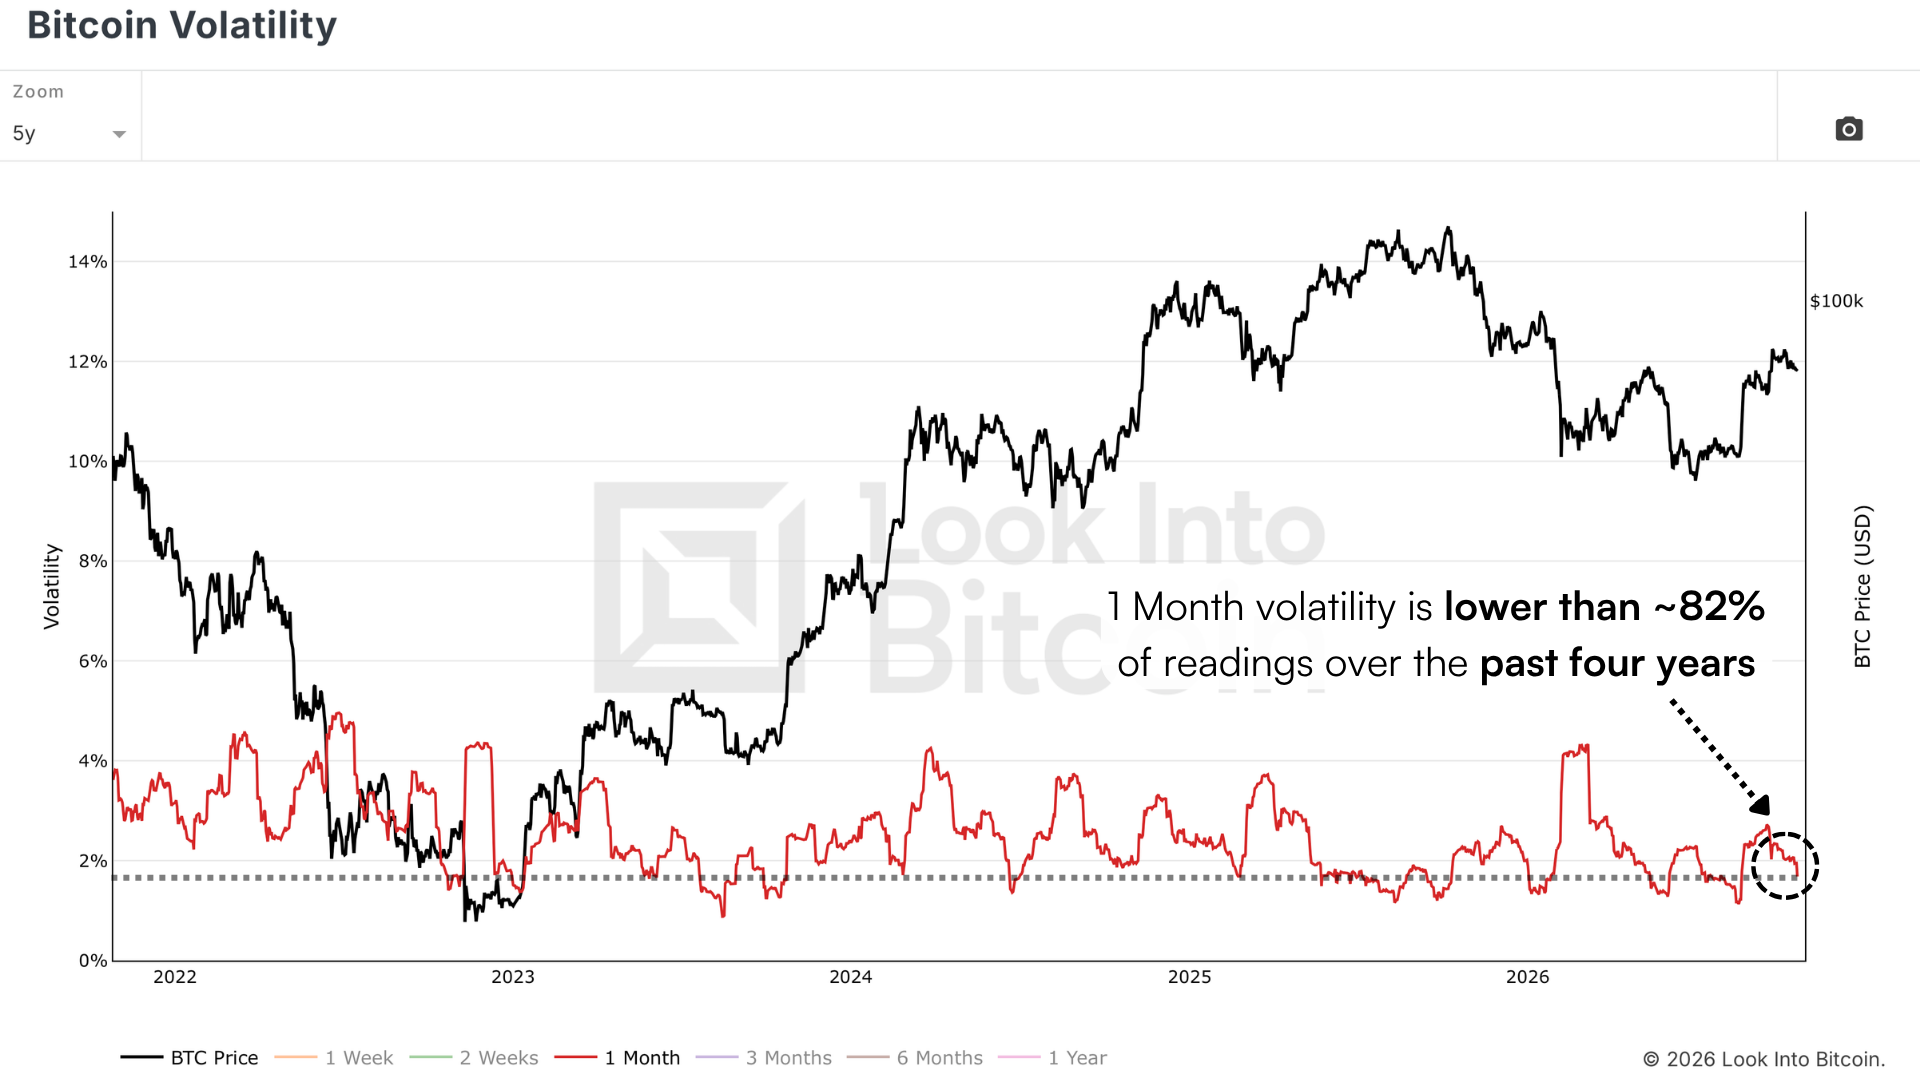
Figure 1: 1-month Bitcoin Volatility drops back to the line marking previous low readings.
Looking back, quieter periods like this have often been followed by much larger moves, some upwards and others sharp breakdowns. Low volatility alone doesn’t tell us which direction comes next or exactly when. But two months of sideways price action isn’t particularly unusual for Bitcoin. Even during the previous bull market, there were stretches of six or seven months where price moved around considerably without making much sustained progress, and I don’t read a quiet market as a sign that something is wrong.
Time To Cool
When Bitcoin first pushed towards $87,000 to $88,000, the Crosby Ratio was reaching its overheated region. After a rally of around 50%, it made sense that the move might need a breather. Those readings have since cooled. The weekly Crosby reading is around the middle of its historical range.
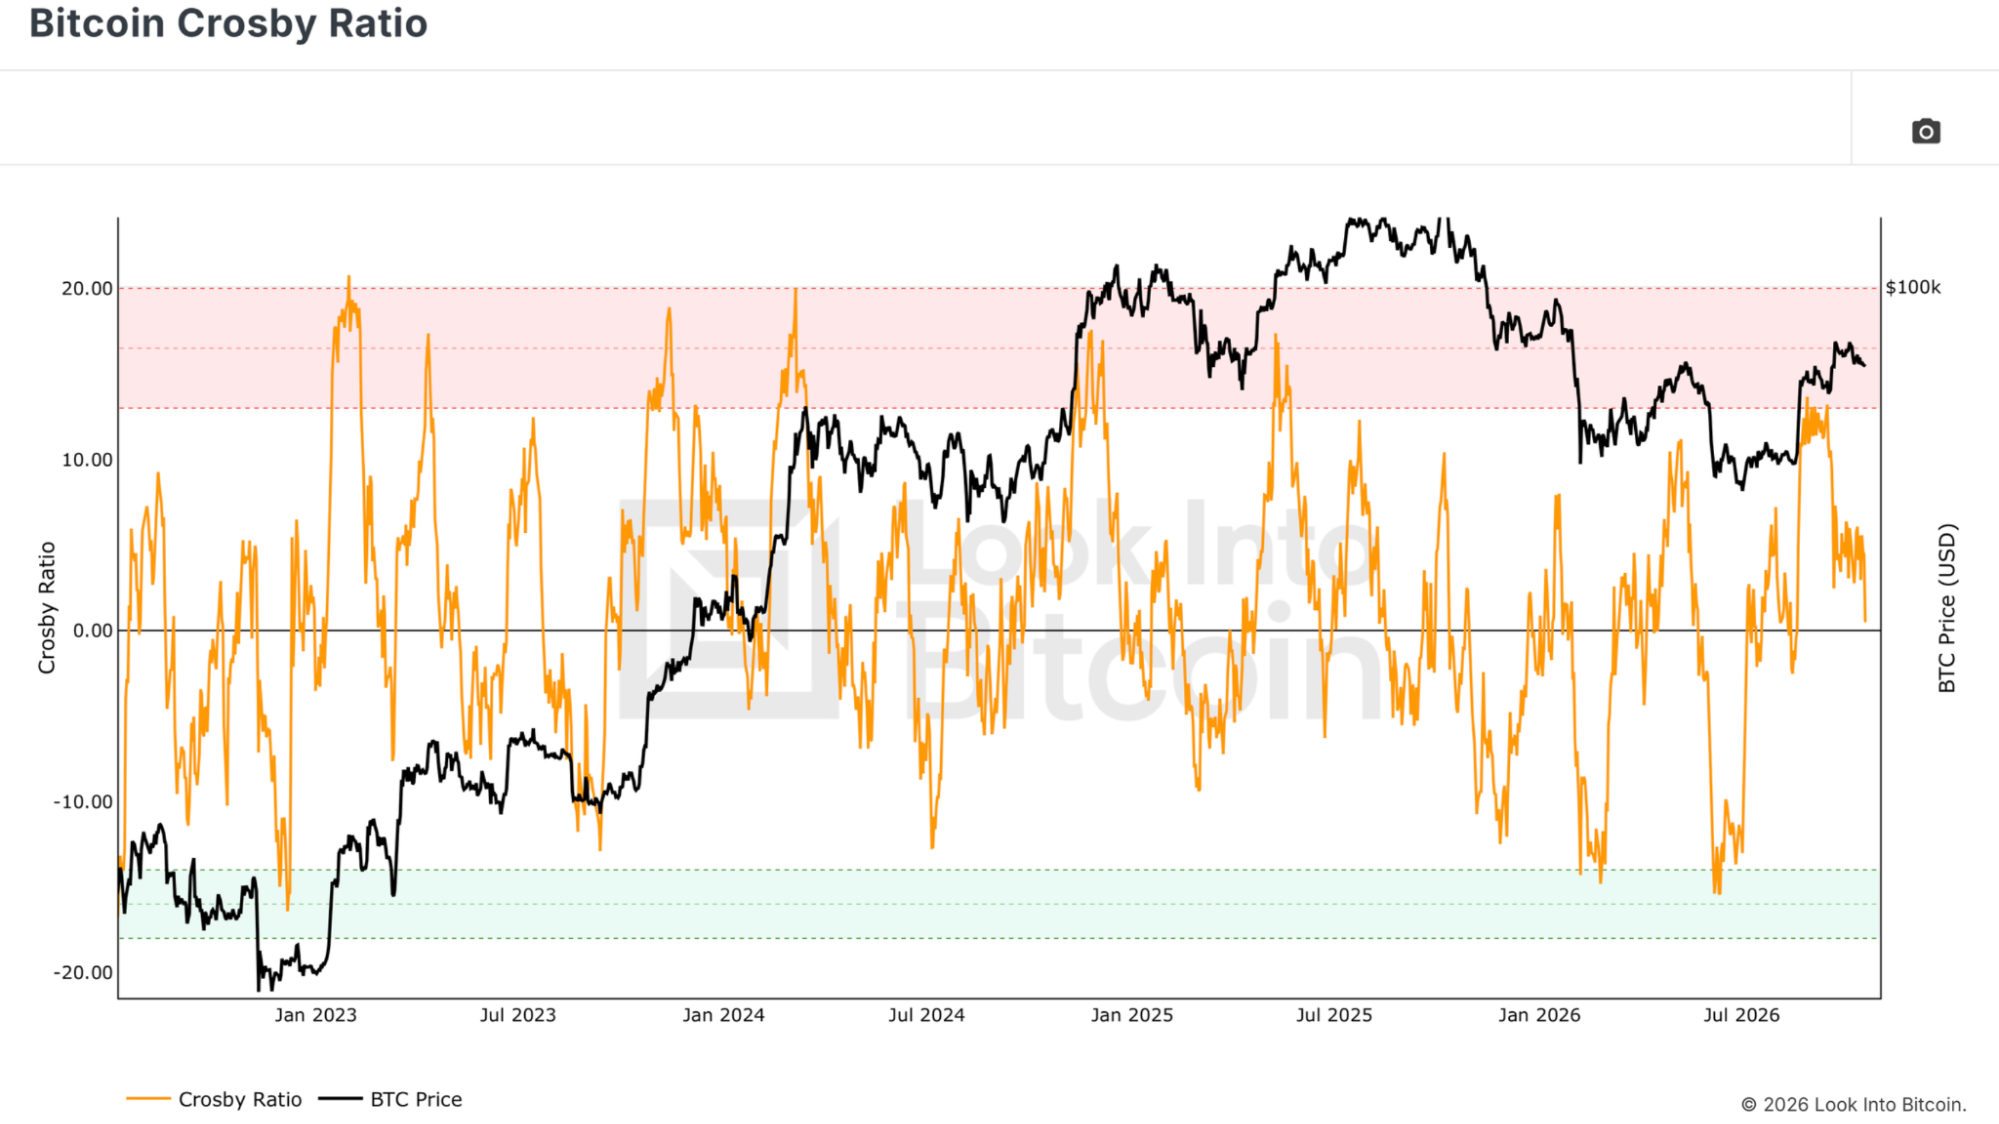
Figure 2: The Crosby Ratio falls back to neutral after touching its overheated band.
Other indicators tell a similar story. Bitcoin Funding Rates have been moving between positive and negative, rather than showing persistent enthusiasm for leveraged longs. The Spent Output Profit Ratio (SOPR) has recorded several days of coins moving at a loss, while the Fear and Greed Index recently sat around 53.
Staying Put
The 1+ Year HODL Wave reveals that the proportion of Bitcoin supply that hasn’t moved for at least a year has also been climbing, recently reaching just under 64%.
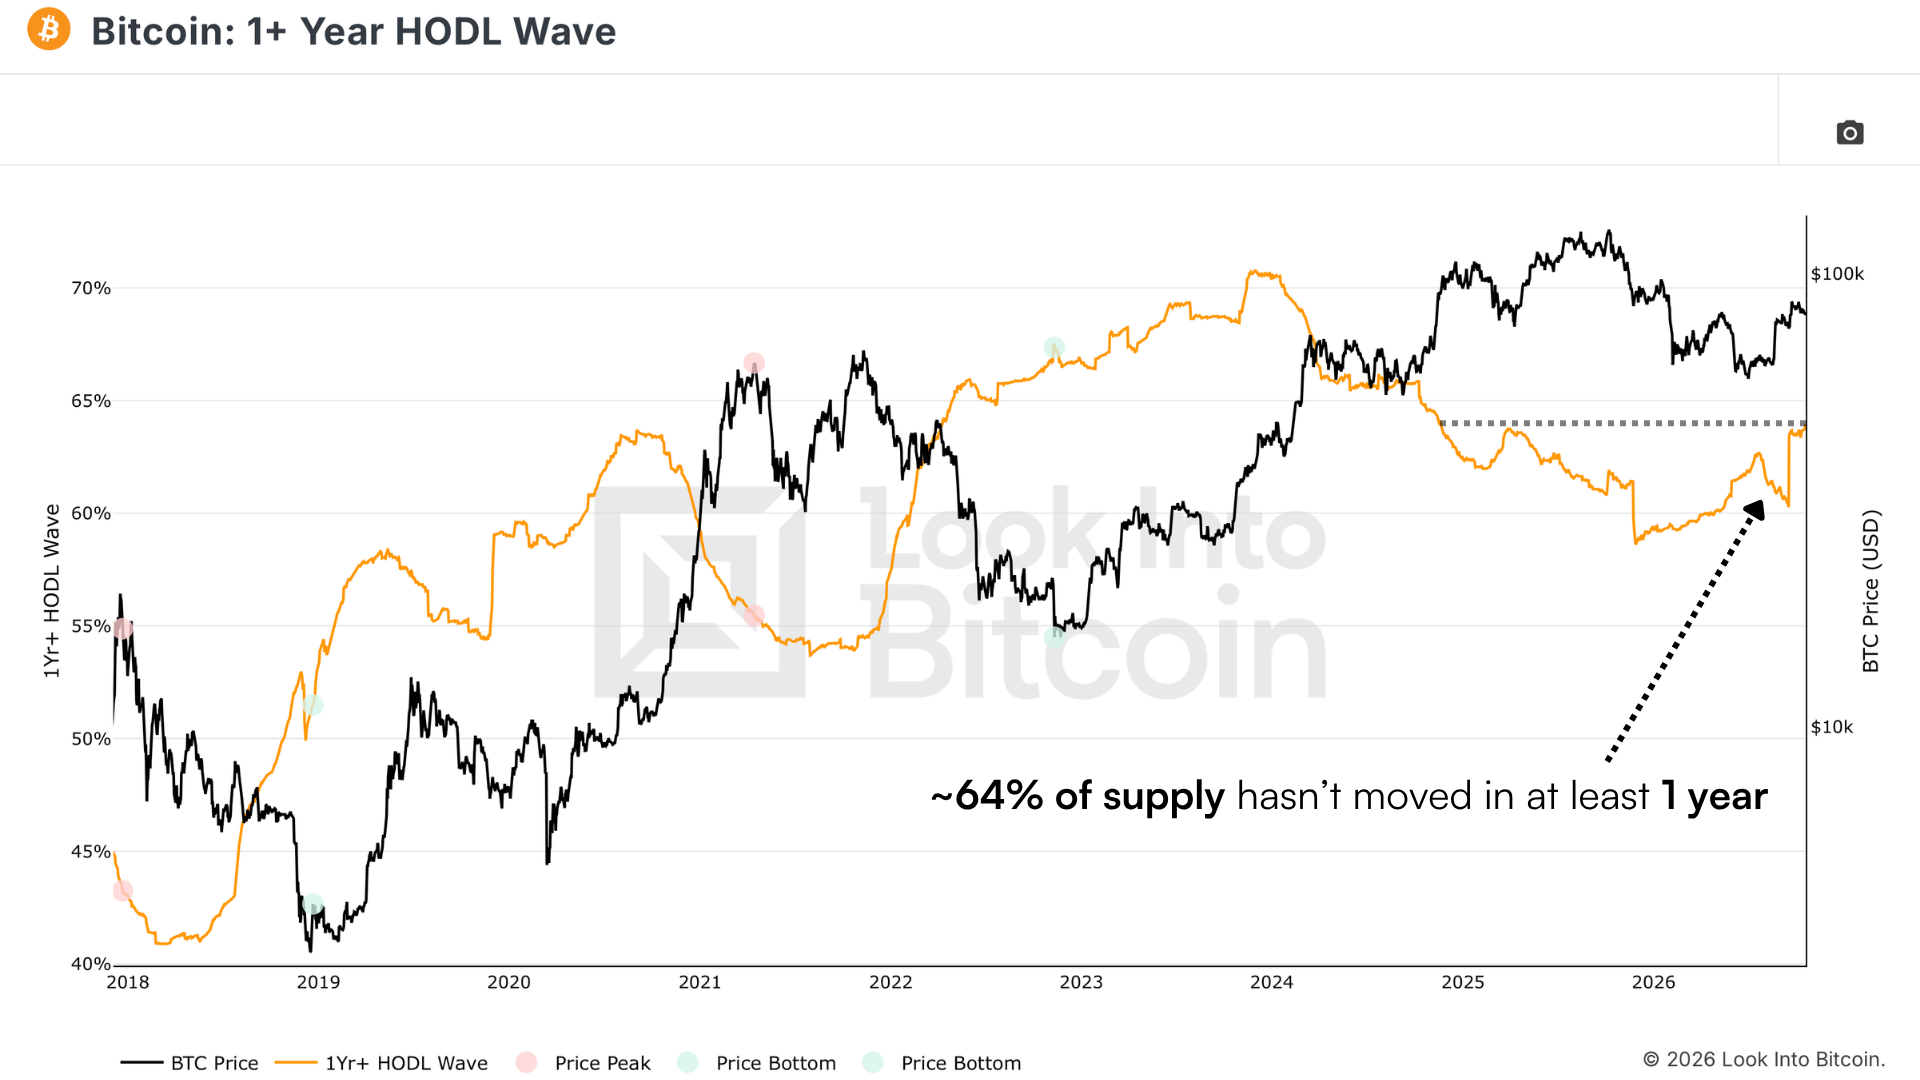
Figure 3: The 1+ Year HODL Wave climbs to ~64% of Bitcoin supply.
Some of that increase comes from coins simply ageing into the one-year category. It doesn’t tell us what every holder is thinking, but it does show that a growing share of supply has remained unmoved despite the recovery.
Where I Stand
Volatility won’t tell us the direction of the next move. But the underlying conditions give me little reason to assume that quiet price action must end badly. We’ve had a substantial rally, a fairly shallow consolidation and time for the market to cool.
For more on this, watch our recent YouTube video here:
Bitcoin Is the Recovery Getting Stronger?
Have a lovely week, and I’ll see you in the next one!
Research Director
Any information on this site is not to be considered as financial advice. Please review the Disclaimer section for more information.