Bitcoin Is In The Bottom 8% Of Its Historical Valuation Range
Aug. 7, 2026
Author: Matt - Director of Research & Analytics
I've been banging on about the MVRV Quantile Bands framework for a while now, but up to this point it was only ever a bit of personal code I put together for content. Quite a few of you made the same point, and it was a fair one. The original backtest ignored fees and taxes, so the returns it showed were never returns anyone would have actually kept. I've rebuilt it as an oscillator running 0 to 100 and rerun the numbers with those costs included. It's available for free on the site now as a permanent chart. Below I'll go through what the chart is actually showing and a simple, but effective accumulation strategy you can build around it.
TL;DR:
- The MVRV Quantile Bands rescale Bitcoin's valuation from 0 to 100 and adjust for the fact that MVRV troughs have risen and its peaks have fallen with each cycle.
- At 8%, the current reading sits in the approximate range where Bitcoin has bottomed in every previous bear market.
- Applying a simple rules-based strategy to the bands beat blind dollar cost averaging on 100% of quarterly start dates from 2014, after a 20% capital gains tax and trading fees.
- The accumulation-only version, for those who never sell, still outperformed on 74% of start dates.
- Since 2014, $100 a week turned $66,700 into roughly $5.8 million after tax, against under $3 million for blind DCA.
The Bands
The input is MVRV, the ratio of Bitcoin's market value to its realized value, which is the average cost basis of every coin on the network. That much is familiar, but a raw MVRV reading means different things in different eras, because the peaks have kept falling and the troughs have kept rising as the asset matured. The bands fit an amplitude decay model to that contraction and normalize the output, so you're reading Bitcoin against its own history rather than a fixed threshold that quietly goes stale. The full methodology is published on the MVRV Quantile Bands chart page if you want to check it.
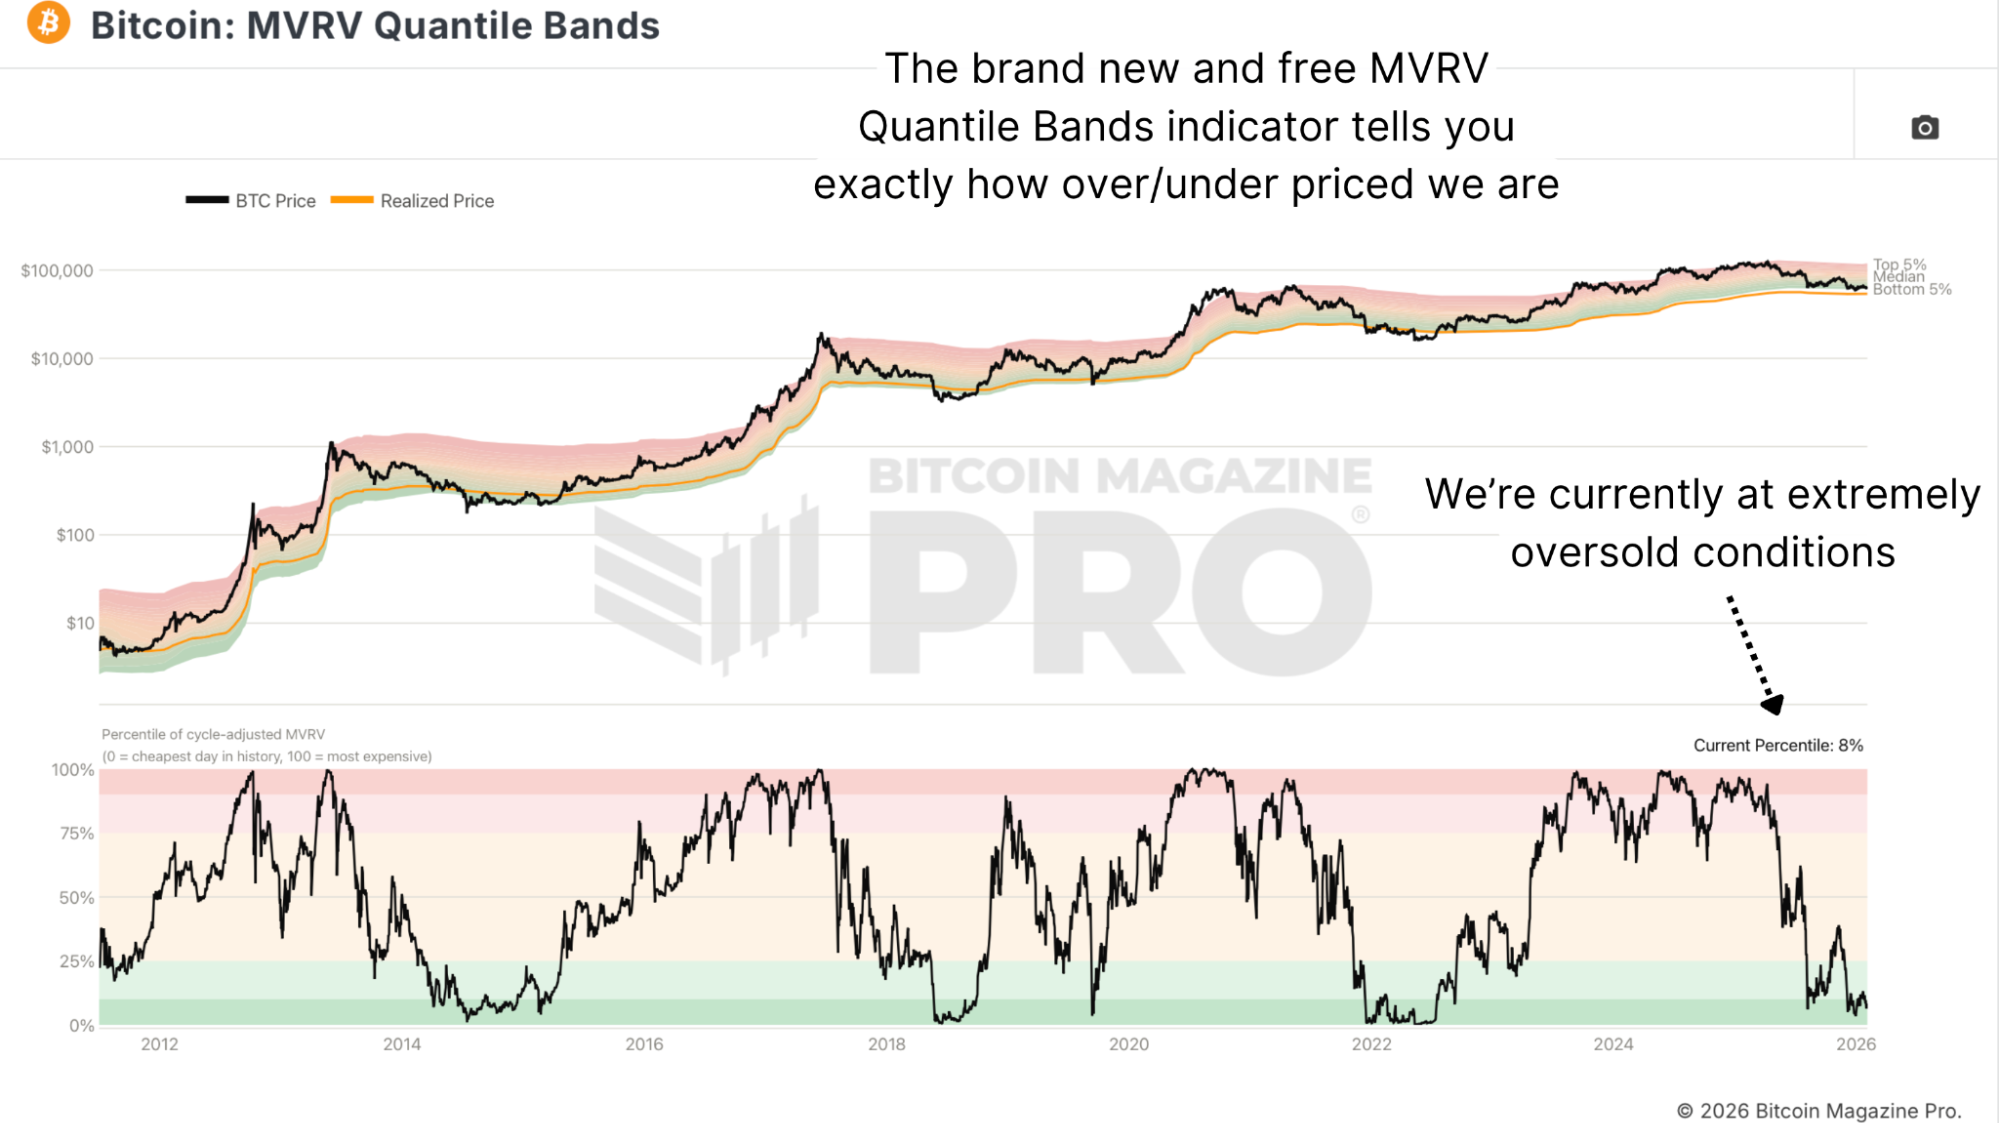
Figure 1: Bitcoin's MVRV Quantile Bands, with cycle-adjusted MVRV at the 8% percentile.
At 8%, Bitcoin sits where it has bottomed in every prior bear cycle. It can go lower, and it has before. In 2022, the oscillator reached these percentiles around $19,000, and price fell another ~20% before the actual low. The shrinking gap to Realized Price is what the model is picking up. In 2015 the low came far below Realized Price, in 2019 less so, in 2022 less again, and this cycle we're hitting these readings before price has even touched it.
The Rules
The strategy splits Bitcoin's history into four regions. For most of the range, between the 10th and 85th percentiles, a majority of all Bitcoin days, you dollar cost average as normal. The 85th sounds like a high bar to still be buying at, but Bitcoin can look mildly overvalued and rally several multiples from there. Between the 85th and 90th, roughly 5% of days, you stop buying and send deposits to a cash reserve instead. Above the 90th, about 12% of days, deposits keep going to the reserve, and you can optionally start trimming. Below the 10th, deposits buy as usual, and you draw the reserve down alongside them.
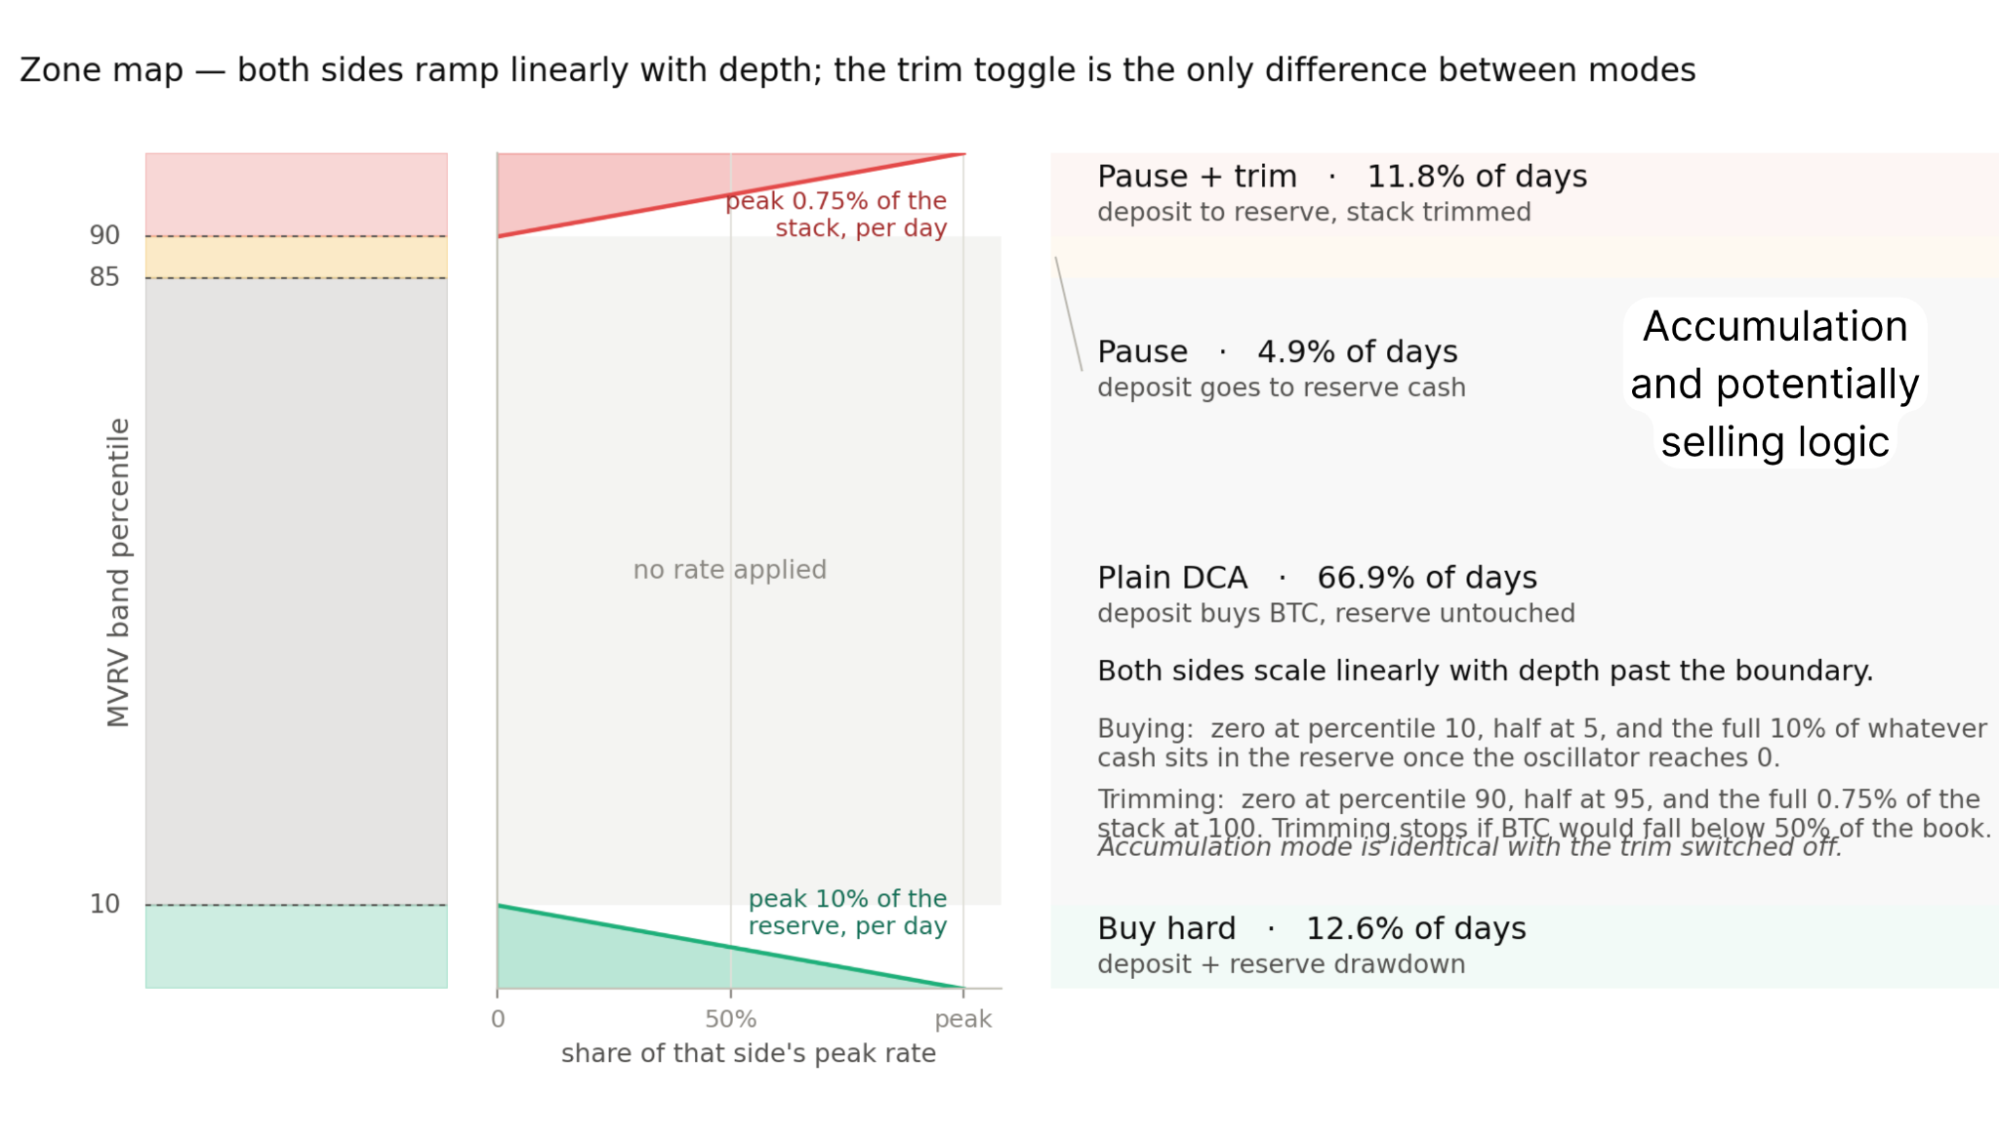
Figure 2: The four MVRV percentile zones and the action each one triggers.
Both the trim and the aggressive buying ramp linearly with depth. Trimming starts at nothing on the 90th percentile, reaches half rate at the 95th, and caps at 0.75% of your stack per day at the very top. That cap is small on purpose, because more than one day in ten falls in this region and you don't want to scale out too early or too hard. Trimming also stops altogether once your holdings would fall below 50% in bitcoin, since selling the lot was never the aim. Cash reserve buying runs the same ramp in reverse, from nothing at the 10th percentile to half at the 5th, up to 10% of the remaining reserve per day at a reading of zero. Accumulation-only mode is the same set of rules with the selling switched off.
The Assessment
Testing one start date proves nothing, so we ran all 39 quarterly start dates from 2014 to 2023. The full buy and sell strategy beat blind dollar cost averaging on every one of them, after 20% capital gains tax on every profitable sale and 0.1% fees per trade. That assumes no allowance thresholds and no loss offsetting, at a fee rate higher than most people pay.
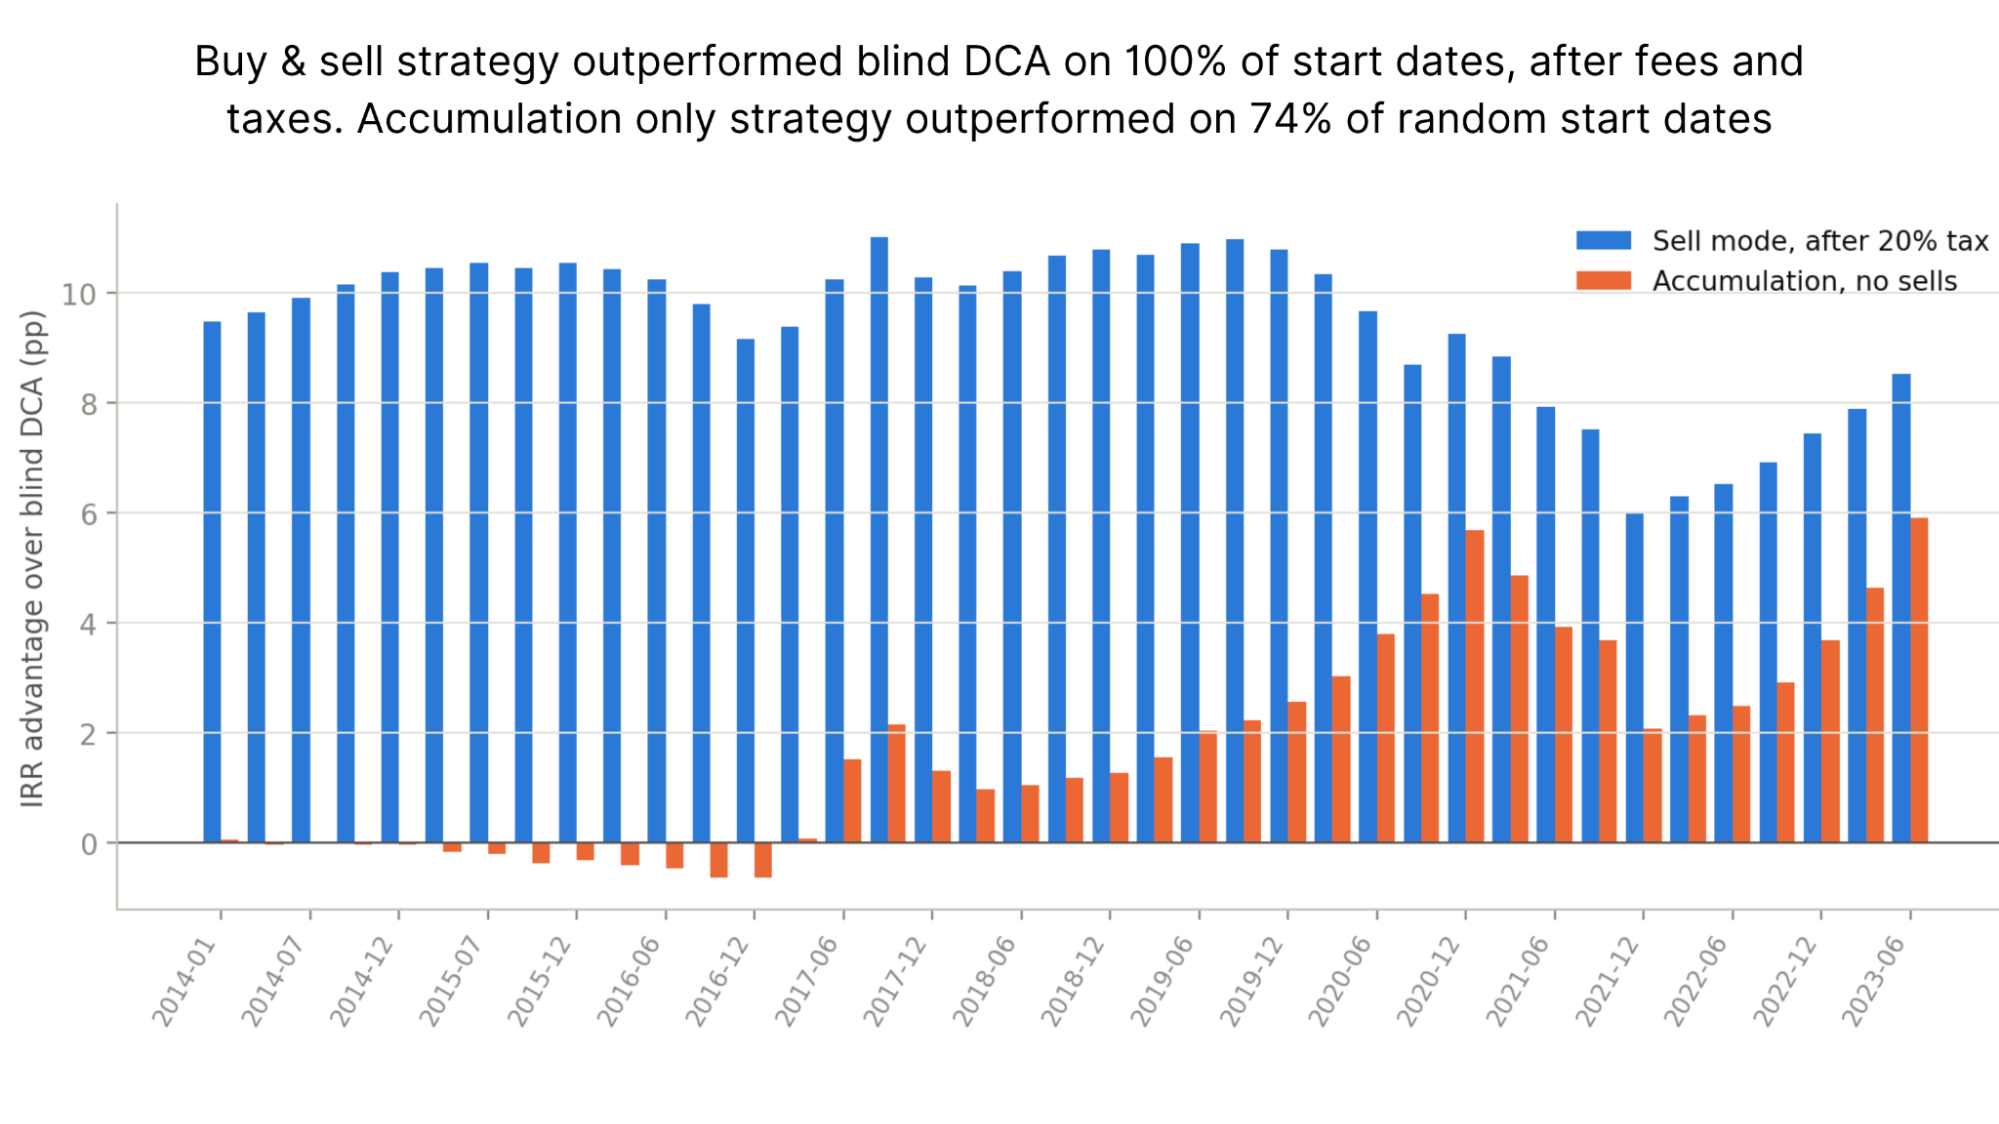
Figure 3: Both strategies against blind DCA, measured from each quarterly start date.
The accumulation-only version outperformed on 74% of start dates. All the misses fall in the 2015 to 2016 window, for a mechanical reason. Starting there, you haven't had time to build much of a cash reserve before the cycle low arrives, and the reserve is what funds the aggressive buying that generates the edge. Every start date after that period outperformed, and the edge is growing.
The Numbers
The main test starts in 2014, near a cycle peak and deliberately the worst entry available, with $100 deposited weekly. Total paid in was $66,700. Blind dollar cost averaging finished at roughly $2.97 million and 46.8 BTC, accumulation-only at $3.12 million and 49.1 BTC. The full strategy, after handing over just over $1 million in tax, finished at roughly $5.79 million and 73.9 BTC.
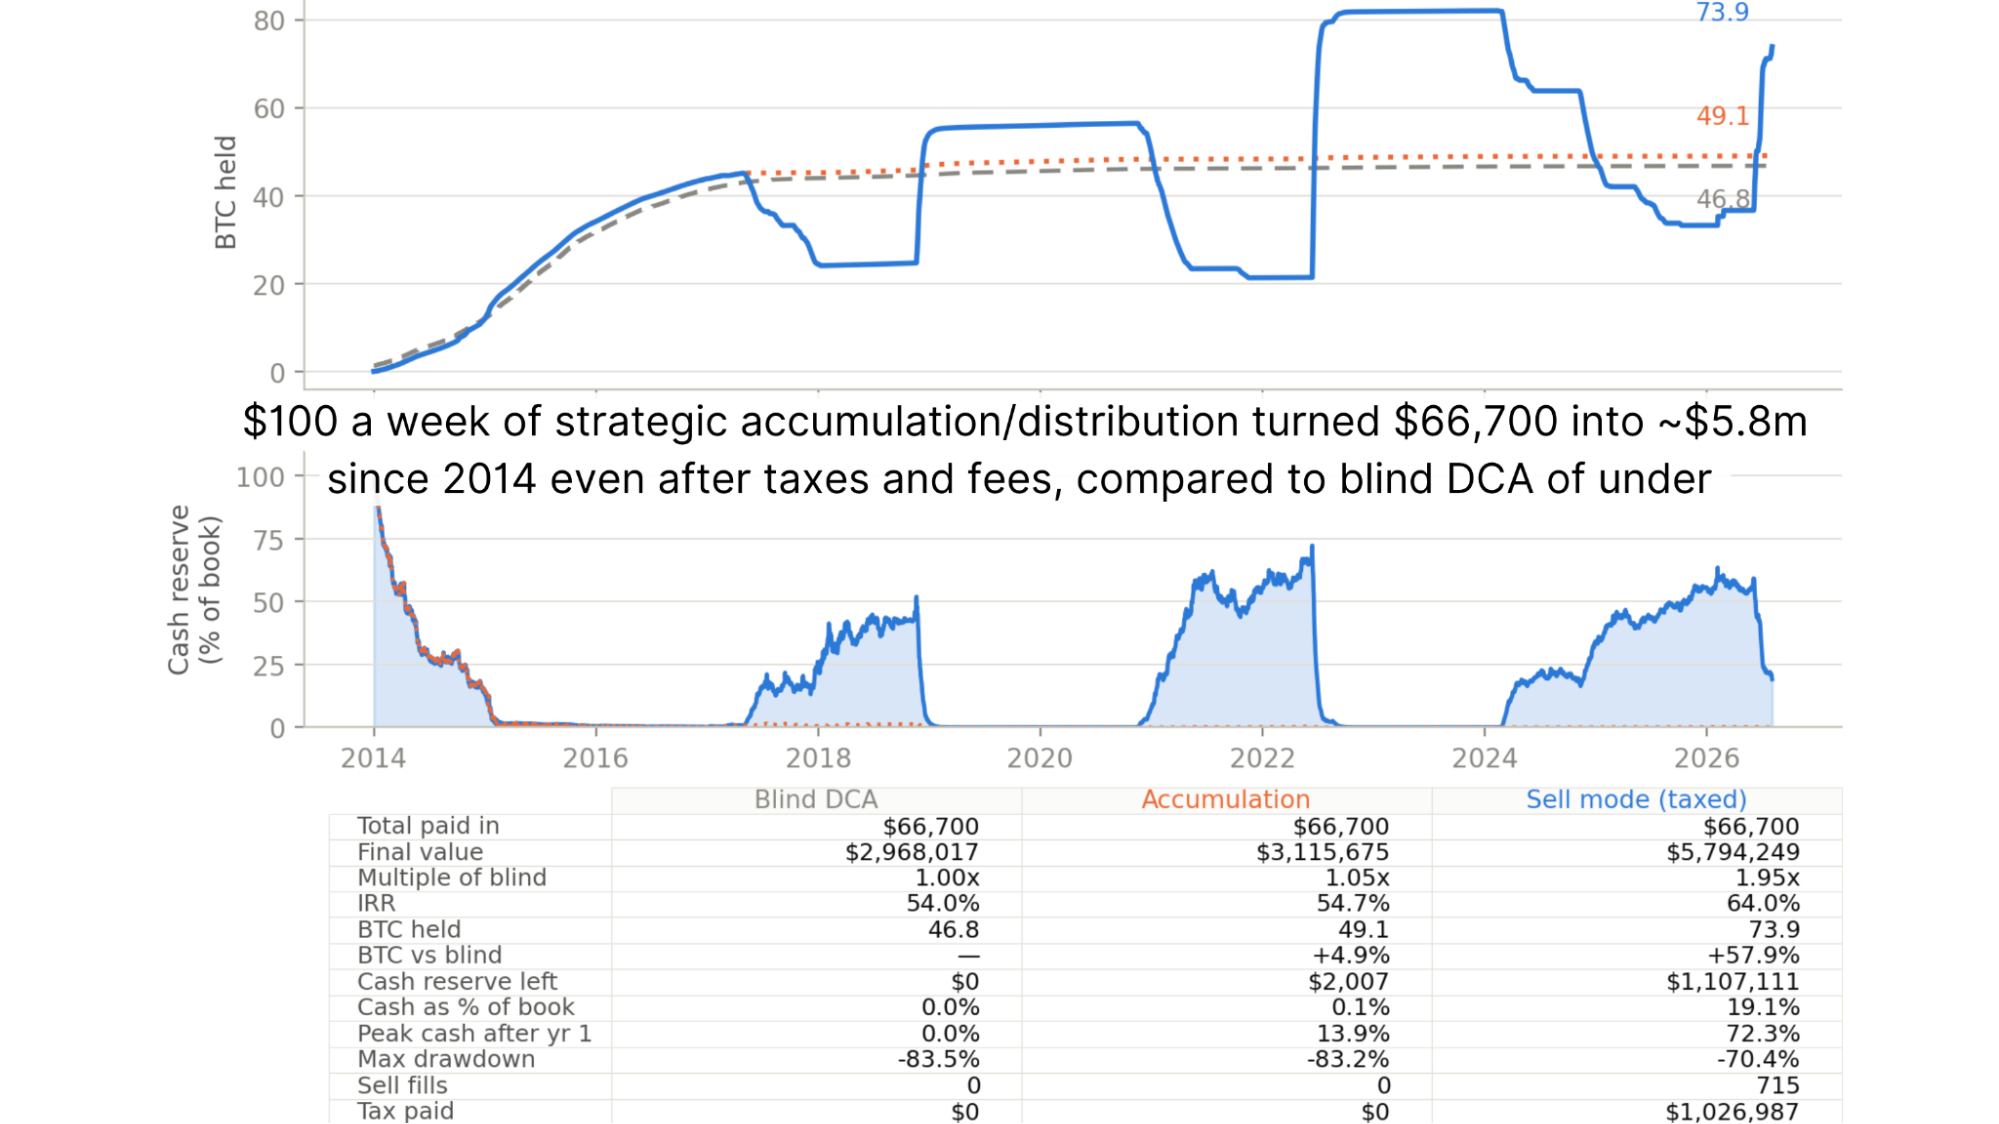
Figure 4: BTC held and cash reserve for each strategy, with final results below.
That's 1.95x blind DCA in dollar terms and 57.9% more bitcoin, tax bill included, with ~13% less drawdown.
The Verdict
Will a simple model like this work forever? Possibly not, and I'd be wary of anyone claiming otherwise. What it does is replace a binary buy-or-sell instinct with something probabilistic, tested across every start date we could throw at it, with the real-world costs included rather than quietly ignored.
If you don't know where to begin with structuring your Bitcoin accumulation, this is not a bad place to start. The chart is free, the methodology is published, and today's reading is 8%. Go and check it yourself and let us know what you think!
Watch our most recent YouTube video here:
The FREE & SIMPLE Strategy That Beats Bitcoin (It Just Flashed Again)
Matt Crosby (@MattCrosbyPro)
Director of Research & Analytics
Any information on this site is not to be considered as financial advice. Please review the Disclaimer section for more information.