
 Bitcoin: Pi Cycle Top & Bottom Indicator
Zoom in with touchscreen: Touch and hold with ONE finger then drag.
Zoom in on desktop: Left click and drag.
Reset: Double click.
Indicator Overview
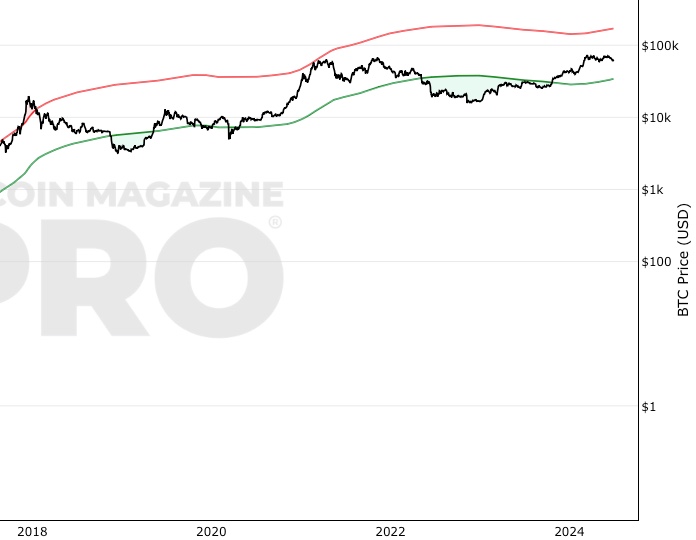
The Pi Cycle Top and Bottom Oscillator is an adaptation of the original Pi Cycle Top chart. It compares the 111-Day Moving Average and the 2 * 350-Day Moving Average of Bitcoin’s Price. These two moving averages were selected as 350 / 111 = 3.153; An approximation of the important mathematical number Pi.
When the 111-Day Moving Average reaches the 2 * 350-Day Moving Average , it indicates that the market is becoming overheated. That is because the mid time frame momentum reference of the 111-Day Moving Average has caught up with the long timeframe momentum reference of the 2 * 350-Day Moving Average.
Historically this has occurred within 3 days of the very top of each market cycle.
When the 111 Day Moving Average falls back beneath the 2 * 350 Day Moving Average , it indicates that the market momentum of that cycle is significantly cooling down. The oscillator drops down into the lower green band shown where the 111 Day Moving Average is moving at a 75% discount relative to the 2 * 350 Day Moving Average.
Historically this has highlighted broad areas of bear market lows.
You May Also Be Interested In

Bitcoin Cycle Master
A combination of on-chain metrics including Coin Value Days Destroyed and Terminal Price.
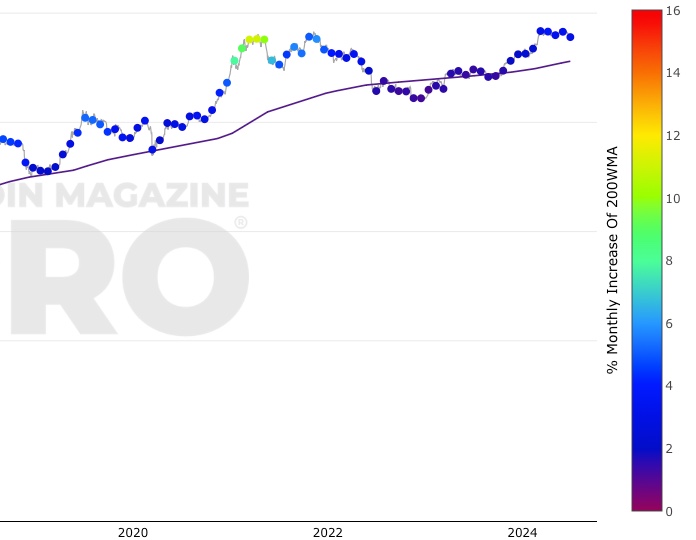
200 Week Moving Average Heatmap
A simple heatmap system based on movements of the 200 week moving average.
Bitcoin Investor Tool: 2-Year MA Multiplier
Long timeframe investor tool to identify under/oversold price periods
Make smarter decisions about Bitcoin. Instantly.
Access the Bitcoin and Global Macro Charts that really drive Bitcoin’s price.
+40 chart alerts. Never miss critical levels on charts again.
Analysis newsletter. Manage your emotions at market extremes.
Private Tradingview indicators. See Bitcoin chart levels in real time!
Cancel anytime.
Any information on this site is not to be considered as financial advice. Please review the Disclaimer section for more information.