
 Bitcoin: Coin Days Destroyed
Zoom in with touchscreen: Touch and hold with ONE finger then drag.
Zoom in on desktop: Left click and drag.
Reset: Double click.
Indicator Overview
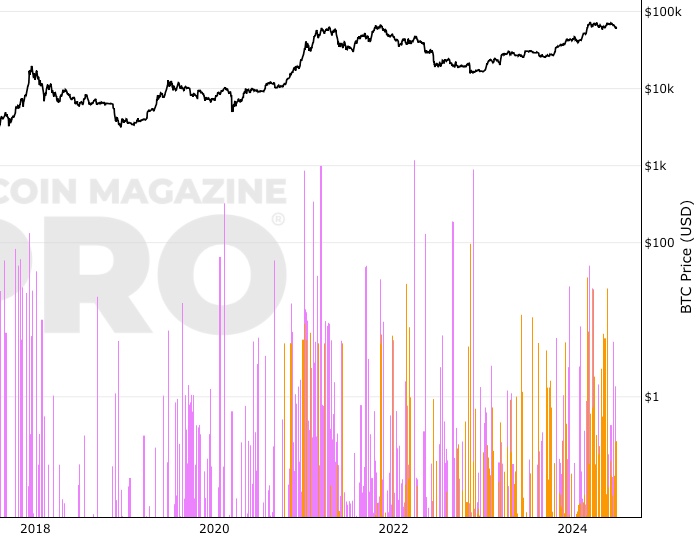
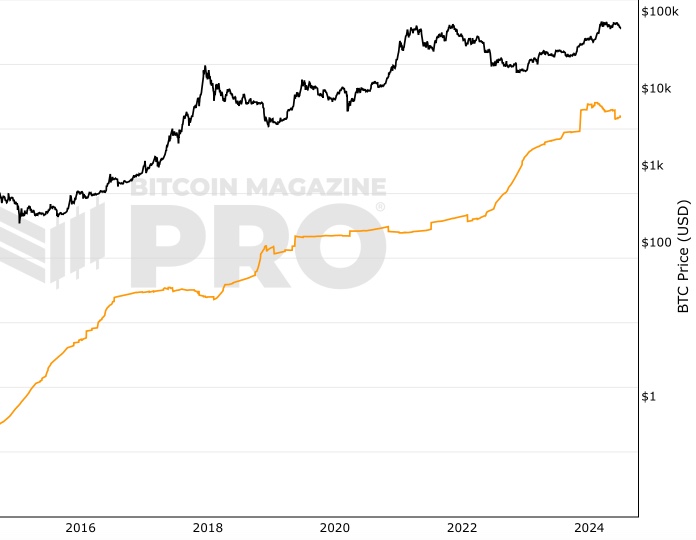
Coin Days Destroyed (CDD) takes the number of coins that have moved on-chain at a particular time and multiples that value by the number of days since those coins were last moved:
Number of coins * days since coins last moved = coin days destroyed (CDD)
Some simple examples showing how Coin Days Destroyed is calculated:
- A UTXO for 5 BTC that has not moved for 100 days has accumulated 500 coin days.
- A UTXO for 10 BTC that has not moved for 1 day has accumulated 10 coin days.
- A UTXO for 0.1 BTC that has not moved for 100 days has also accumulated 10 coin days.
This metric, therefore, gives an extra weighting to coins that have not moved for a long period of time.
Why would we do this? Because Bitcoin investors who have been in the market for long periods of time and have accumulated bitcoin are likely to have a greater understanding of Bitcoin’s price cycles versus newer entrants into the market.
We can therefore consider them to be ‘smart(er) money’. For this reason, there is value in tracking large movements in coin days destroyed over time.
Coin Days Destroyed is sometimes also referred to as Bitcoin Days Destroyed.
How to Use this Indicator
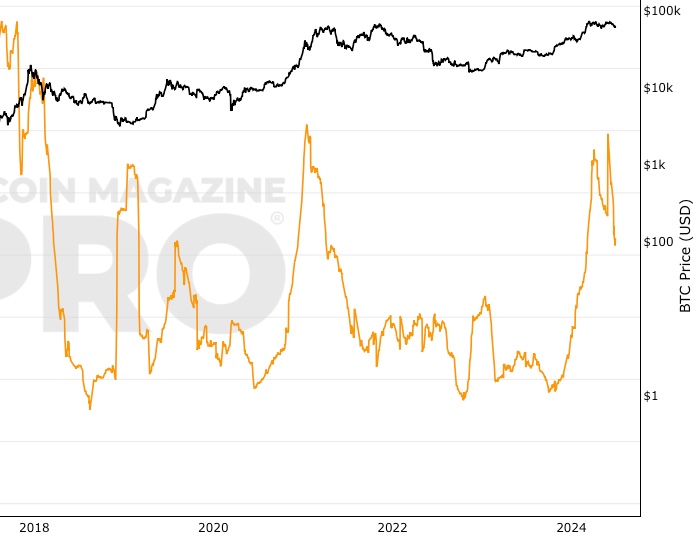
The raw data taken from the blockchain for this metric can be erratic and noisy. Typically moving averages are therefore used to smooth out the data to make trends more visible to see.
This allows the strategic investor to interpret the data more easily. When doing so it is noteworthy that coin days destroyed typically jump up at critical times in Bitcoin’s price action.
The reason for this is that investors with large amounts of bitcoin that have been held in wallets for long periods of time, tend to move their bitcoin between wallets (most likely to sell) at those key times.
Created By
This metric was first mentioned by a bitcointalk.org user, ByteCoin in 2011.
You May Also Be Interested In
Whale Shadows (aka Revived Supply)
Onchain tracking of old coins moving again in large amounts.
5+ Years HODL Wave
Bitcoin 5+ year HODL wave chart, showing percentage of bitcoin that has not moved onchain for 5+ years.
Supply Adjusted Coin Days Destroyed
Number of coins multiplied by days since those coins last moved on-chain, adjusted for bitcoin supply.
Make smarter decisions about Bitcoin. Instantly.
Access the Bitcoin and Global Macro Charts that really drive Bitcoin’s price.
+40 chart alerts. Never miss critical levels on charts again.
Analysis newsletter. Manage your emotions at market extremes.
Private Tradingview indicators. See Bitcoin chart levels in real time!
Cancel anytime.
Any information on this site is not to be considered as financial advice. Please review the Disclaimer section for more information.