
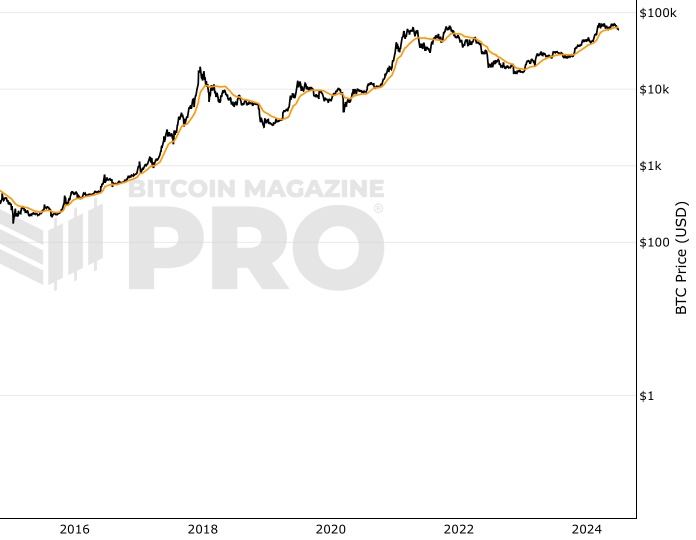
 Bitcoin: Value Days Destroyed (VDD) Multiple
Zoom in with touchscreen: Touch and hold with ONE finger then drag.
Zoom in on desktop: Left click and drag.
Reset: Double click.
Indicator Overview
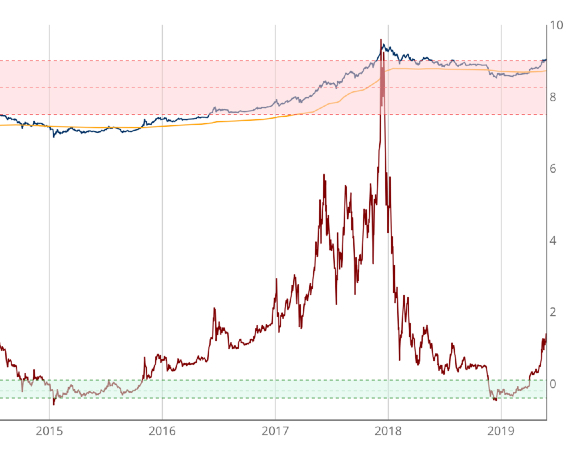
Value Days Destroyed (VDD) Multiple aims to identify when the price of Bitcoin may be becoming frothy and close to topping out at major cycle highs.
It uses the principle of Coin Days Destroyed which you can learn more about on the Coin Days Destroyed live chart page. Coin Days Destroyed is a proxy for spending velocity that gives extra weighting to coins that have not moved onchain for longer periods of time.
Value Days Destroyed multiplies Coin Days Destroyed by $BTC price, thereby allowing for better comparisons of spending activity over time as the price of $BTC varies.
Value Days Destroyed Multiple then divides a 30-day average of VDD by a 365 average to compare near-term spending velocity with a yearly average of spending velocity.
It is able to highlight when older coins begin to rapidly enter the market to be sold. This typically happens when longer-term participants look to take profits as price accelerates up in major bull market cycles.
This phenomenon of old coins entering the market eventually causes price to drop as supply exceeds demand and the bull market is brought to an end.
How To View The Chart
Extreme value days destroyed are highlighted by red candles on the chart when a VDD score of +2.9 is reached. Only 5% of Bitcoins history has traded above this level, demonstrating how extreme such periods are. These periods have historically aligned with Bitcoin major cycle highs.
Created By
Date Created
Nov 2021
Fall Further Down The Rabbit Hole
You can learn more about Value Days Destroyed (VDD) Multiple in the paper A New Experiment in Cumulative Destruction.
You May Also Be Interested In
Short-Term Holder Realized Price
Average price at which short-term investors have purchased their Bitcoin.
MVRV Z-Score
Pulls apart differences between Market Value and Realised Value to identify market cycle highs and lows.
Long-Term Holder Realized Price
Average price at which long-term investors have purchased their Bitcoin.
Make smarter decisions about Bitcoin. Instantly.
Access the Bitcoin and Global Macro Charts that really drive Bitcoin’s price.
+40 chart alerts. Never miss critical levels on charts again.
Analysis newsletter. Manage your emotions at market extremes.
Private Tradingview indicators. See Bitcoin chart levels in real time!
Cancel anytime.
Any information on this site is not to be considered as financial advice. Please review the Disclaimer section for more information.