
 Bitcoin: Bitcoin Funding Rates
Zoom in with touchscreen: Touch and hold with ONE finger then drag.
Zoom in on desktop: Left click and drag.
Reset: Double click.
What Are Funding Rates?
The crypto funding rate indicates how much a trader has to pay, or how much they will receive every 8 hours (typically), for being long or short on a perpetual contract.
The amount they have to pay or receive is dependent on the difference in price between the perpetual contract they are trading versus the spot price - which is the price it would cost to buy Bitcoin on an exchange at that time. The spot price is sometimes also referred to as the index price.
Funding Rates Are Used On Perpetual (Perp) Swap Contracts
So what are Perpetual (Perp) swap contracts?!
On the defirate website they define perpetual contracts as follows:
A perpetual contract is a derivative financial contract that has no expiration date or settlement, allowing it to be held or traded for an indefinite amount of time.You may have heard of Futures contracts before in traditional markets. They are financial contracts that allow people to buy or sell a product at a pre-determined price in the future. They, therefore, have an expiration date in the future when the contracts settle.
As the name suggests, perpetual contracts have no end date. So unlike traditional futures contracts, you can hold them indefinitely. They are unique to Bitcoin and Crypto.
They typically allow traders to use leverage when betting on whether the price of Bitcoin will go up or down.
How Do Funding Rates Work?
When many traders are either long or short it can push the price of the perpetual contract they are trading further away from the spot price. The funding rate mechanism is a way to ensure that the perpetual contract price does not move too far away from the spot price.
Because if, for example, many traders are long and heavily buying the perpetual contract, that can push the perpetual contract price higher than the spot price. Those traders are then periodically required to pay the funding rate on their open positions to traders who are short.
The higher they push the perp contract price away from the spot price, the greater the funding payments they have to make to traders who are shorting the contract.
This is a way to incentivize traders to position themselves in such a way that broadly speaking, over time the perpetual contract price and spot price of the asset will converge and typically be fairly close to each other.
Why Is It Important To Know The Funding Rate?
By understanding the funding rate, we can broadly identify how the majority of traders are positioned in the market. The below is an oversimplification but we can generally say:
Positive funding rate = traders are typically taking long positions and are overall bullish expecting price to move higher.
Negative funding rate = traders are typically taking short positions and are overall bearish expecting price to move lower.
This is valuable information to have because typically, retail traders are wrong when the market is at extremes. For example, we have seen historically with $BTC perpetual contracts that when btc funding rates go heavily negative, meaning traders are paying funding rates to be short, this has signaled major lows in the price of $BTC, and the price rallied upwards soon afterward.
So it is worth keeping an eye on when the funding rate goes extremely negative, indicating that short traders pay long traders at that time. That has been an unusual event in Bitcoin's history as typically funding rates are positive.
How To Use This Bitcoin Chart Data For Investing
This Bitcoin chart data can be useful as it showcases how the majority of traders in the market are positioned. This is valuable to know when funding rates are either extremely positive or negative as it may indicate that $BTC price may reverse in the near future.
Using this indicator in isolation to make such judgments is not advised. But when used as part of an analysis of both the derivatives market and also the overall market, it can be very useful.
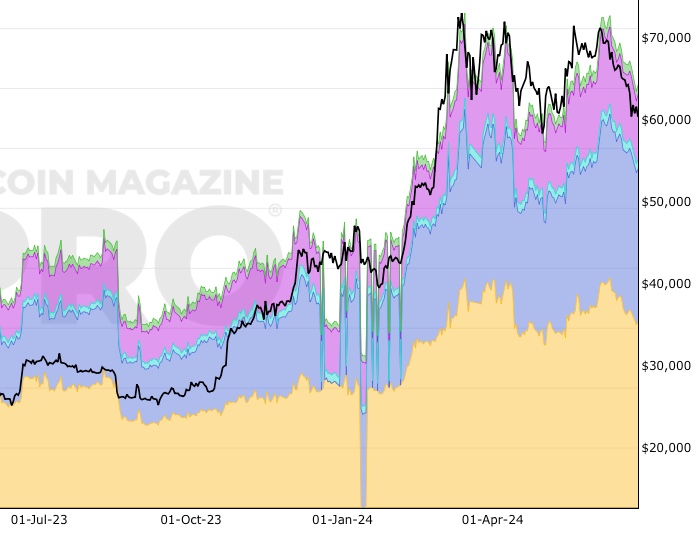
The chart above shows the average funding rate (in %) set by exchanges for perpetual futures contracts. This average funding rate across exchanges is an average of each exchange's funding rate weighted by the Open Interest on that exchange.
Data Sources
We show funding rates for the following derivatives exchanges:
- Binance
- FTX
- OKX
- Bybit
- Bitfinex
Similar Charts That You May Find Useful
The funding rate chart is showing data from the derivatives market. Another chart that takes data from the derivatives market is Open Interest.
You May Also Be Interested In
Bitcoin Open Interest
Value of open derivative contracts.
Make smarter decisions about Bitcoin. Instantly.
Access the Bitcoin and Global Macro Charts that really drive Bitcoin’s price.
+40 chart alerts. Never miss critical levels on charts again.
Analysis newsletter. Manage your emotions at market extremes.
Private Tradingview indicators. See Bitcoin chart levels in real time!
Cancel anytime.
Any information on this site is not to be considered as financial advice. Please review the Disclaimer section for more information.