
 Bitcoin: Realized Cap HODL Waves
Zoom in with touchscreen: Touch and hold with ONE finger then drag.
Zoom in on desktop: Left click and drag.
Reset: Double click.
Indicator Overview
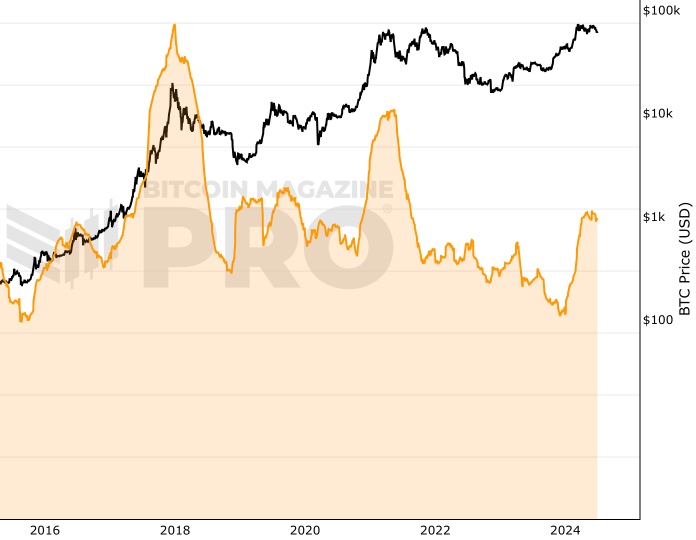
This tool is an adaptation of HODL waves which shows the total amount of bitcoin in circulation at a given time, grouped into different age bands.
Realized Cap HODL Waves, sometimes referred to as RHODL Waves, builds on that idea by weighting the HODL wave by the Realized price of coins in each HODL wave bracket.
You can learn about Realized Price on its live chart page. In summary though, Realized Price is the cost basis of bitcoins (or UTXO’s to be more precise) held in wallets at a given point in time i.e. the price at which they were purchased.
So RHODL waves are telling us the cost basis of bitcoins that have been held in wallets for different periods of time. Each time period is shown by the waves on the chart.
How to Use this Indicator
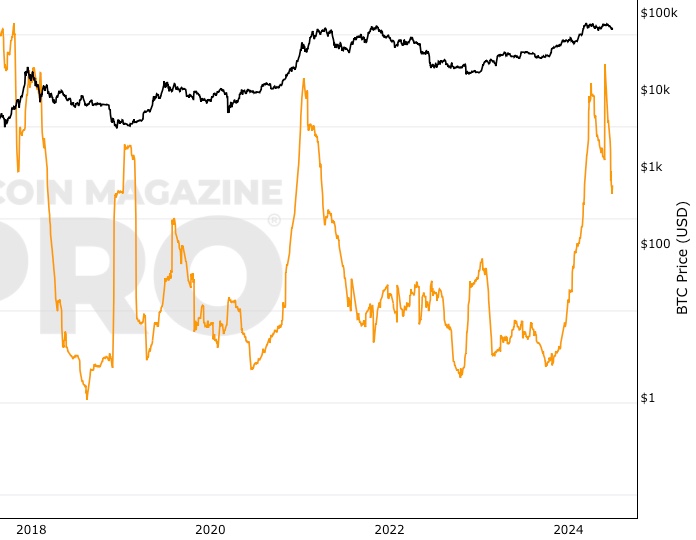
Peaks in younger age bands highlight periods where they have a proportionally higher Realized Value weighting relative to the older Realized Value age bands.
This is important to note as it indicates that the market is prepared to pay higher values for bitcoin today and in recent times, versus historical norms. This can be a good indicator that the market is becoming overheated.
The inverse is also true. When the higher age bands are dominating, it can indicate that investors at that time are fearful and not prepared to pay perceived high values relative to what has occurred previously. This typically occurs at major cycle lows when Bitcoin is no longer exciting or appealing to the average investor.
Created By
The original HODL waves concept was developed by Dhruv Bransal of Unchained Capital. The idea for this particular view was then shared by @typerbole on Twitter.
Similar Live Charts That You May Find Useful
The HODL Waves, +1yr HODL Wave chart, and RHODL Ratio use similar concepts to the Realized Cap HODL Waves chart.
You May Also Be Interested In
Short Term Holder Supply
Circulating bitcoin supply that is held by short term holders.
Coin Days Destroyed
Number of coins multiplied by days since those coins last moved on-chain.
Whale Shadows (aka Revived Supply)
Onchain tracking of old coins moving again in large amounts.
Make smarter decisions about Bitcoin. Instantly.
Access the Bitcoin and Global Macro Charts that really drive Bitcoin’s price.
+40 chart alerts. Never miss critical levels on charts again.
Analysis newsletter. Manage your emotions at market extremes.
Private Tradingview indicators. See Bitcoin chart levels in real time!
Cancel anytime.
Any information on this site is not to be considered as financial advice. Please review the Disclaimer section for more information.