Onchain Movement Charts
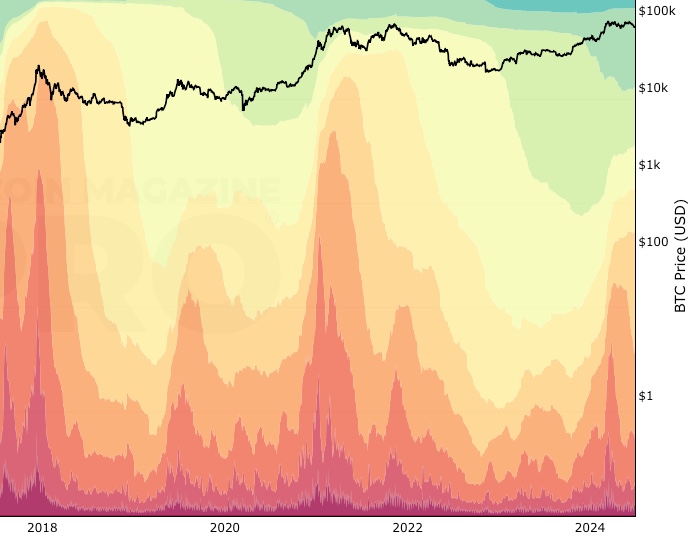
HODL Waves
Percentage of bitcoins that have last moved on-chain within specific time frames.
1+ Year HODL Wave
View of the percentage of coins HODL'd on the blockchain for over 1 year.
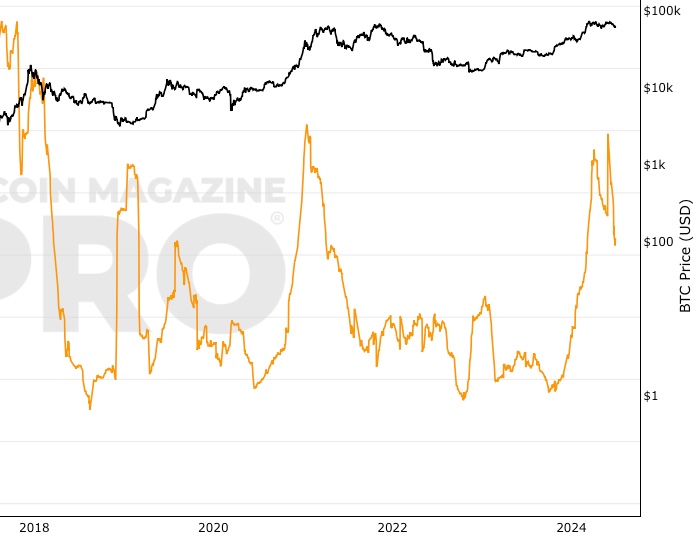
5+ Years HODL Wave
Bitcoin 5+ year HODL wave chart, showing percentage of bitcoin that has not moved onchain for 5+ years.
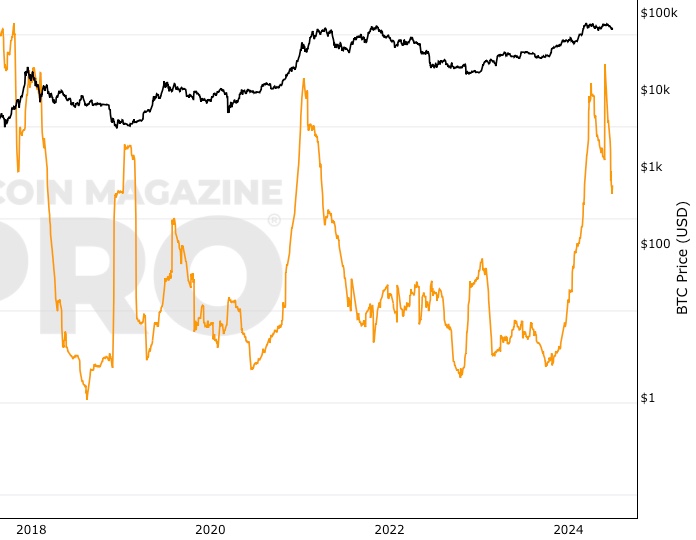
10+ Years HODL Wave
Bitcoin 10+ year HODL wave chart, showing percentage of bitcoin that has not moved onchain for 10+ years.
Realized Cap HODL Waves
The cost basis of UTXO’s held within specific age bands.
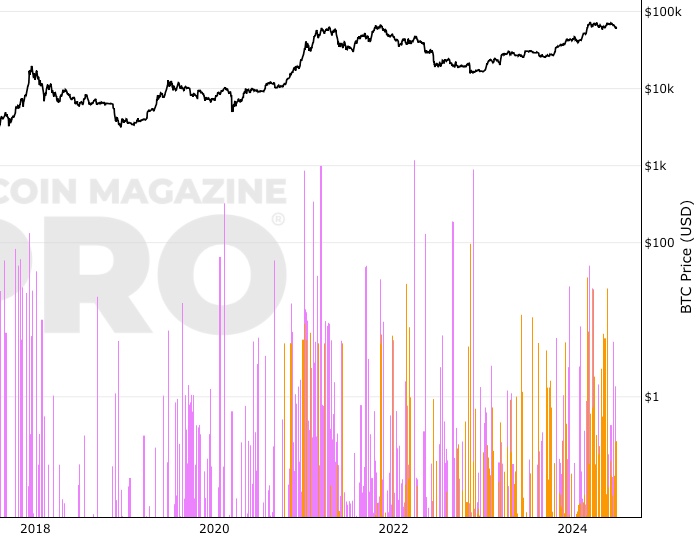
Whale Shadows (aka Revived Supply)
Onchain tracking of old coins moving again in large amounts.
Coin Days Destroyed
Number of coins multiplied by days since those coins last moved on-chain.
Supply Adjusted Coin Days Destroyed
Number of coins multiplied by days since those coins last moved on-chain, adjusted for bitcoin supply.
Long Term Holder SupplyNew
Circulating bitcoin supply that is held by long term holders.
Short Term Holder SupplyNew
Circulating bitcoin supply that is held by short term holders.
Please note, the indicators above are experimental. There is no guarantee certain rules within each model will continue to apply as Bitcoin progresses along its adoption journey. Any information on this site is not to be considered financial advice. Please review the Disclaimer section for more information.