Market Cycle Charts
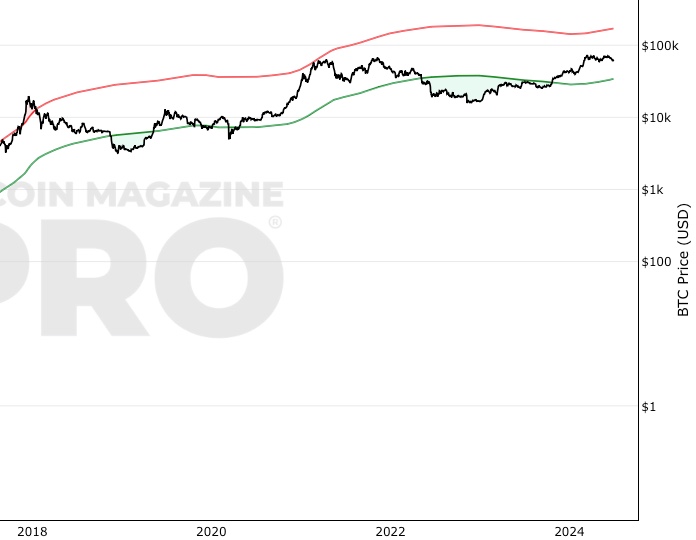
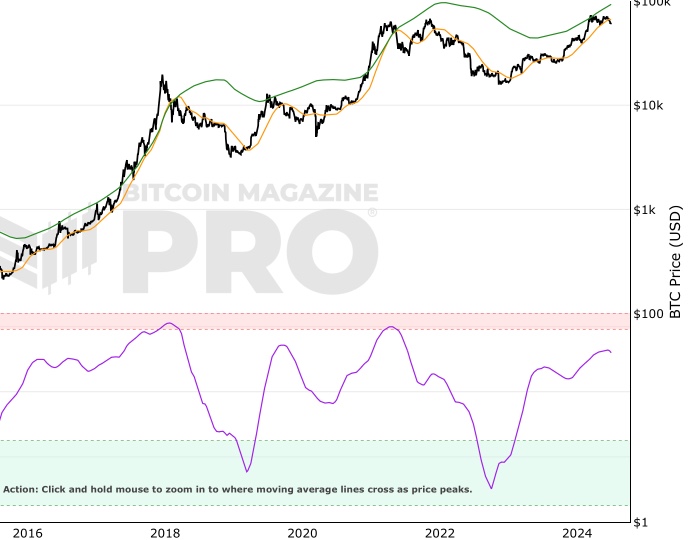
Bitcoin Investor Tool: 2-Year MA Multiplier
Long timeframe investor tool to identify under/oversold price periods
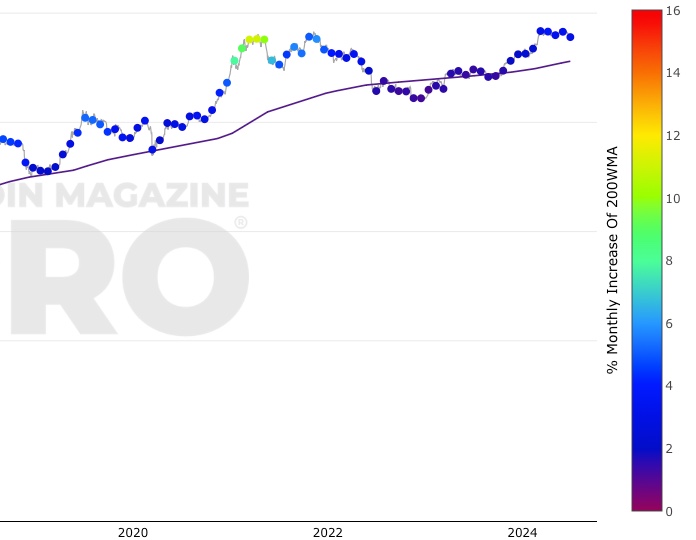
200 Week Moving Average Heatmap
A simple heatmap system based on movements of the 200 week moving average.
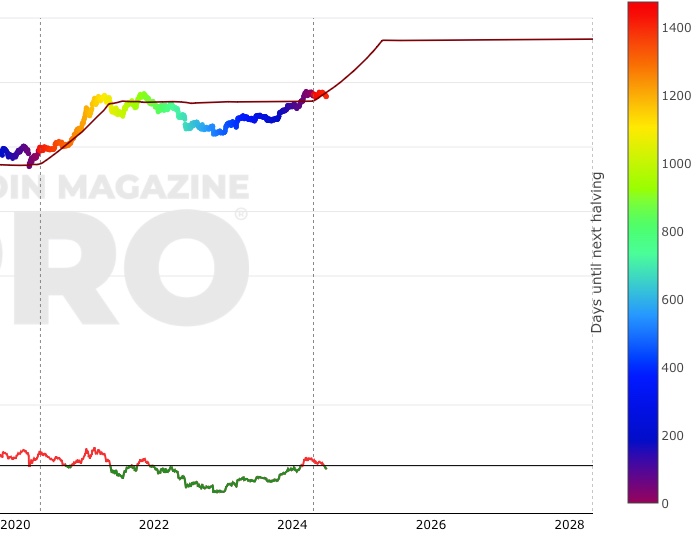
Stock-to-Flow Model
Ratio of bitcoins in circulation relative to the amount of bitcoins annually mined, and this ratio's relationship with price
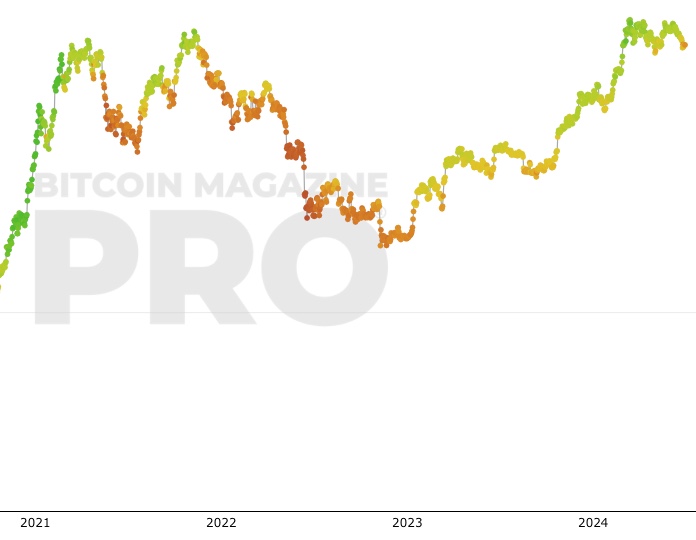
Fear And Greed Index
Market sentiment tool gauging investor fear and greed over time.
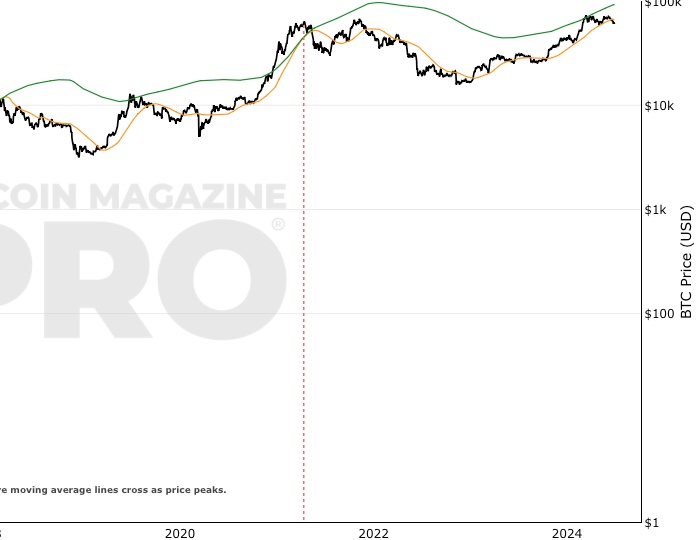
Pi Cycle Top Indicator
Moving average and moving average multiples to pick market cycle highs to within 3 days.
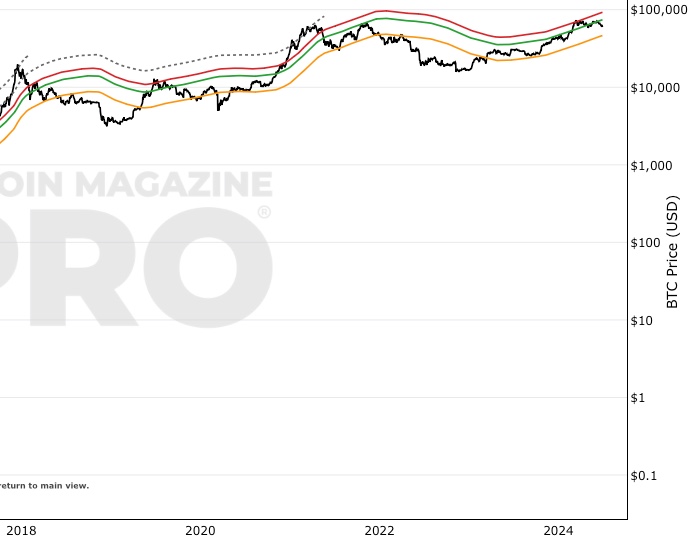
The Golden Ratio Multiplier
Uses Bitcoin's growth adoption curve and market cycles to identify both intracycle and full-cycle price highs.
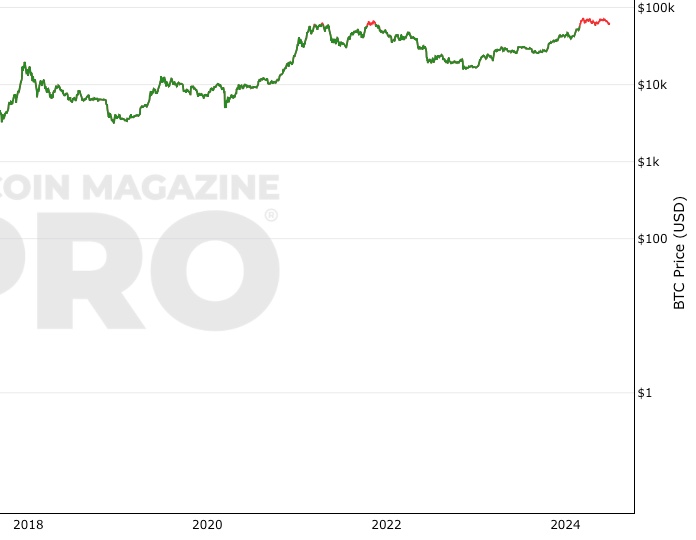
Bitcoin Profitable Days
The proportion of days in Bitcoin's traded history that it has been profitable to hold Bitcoin
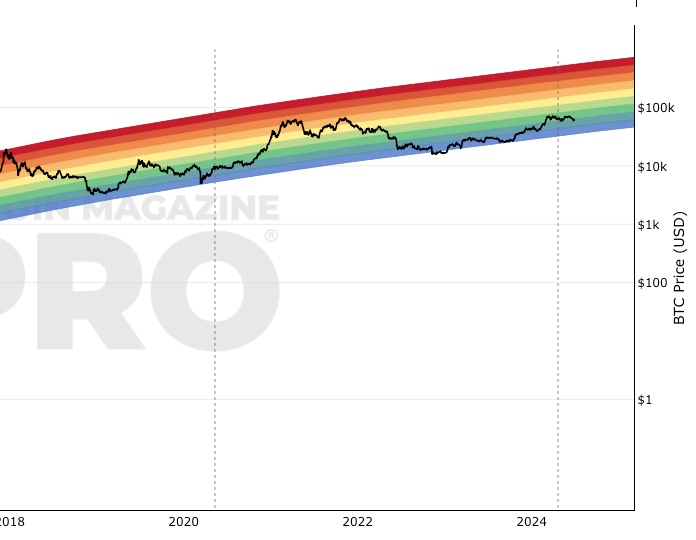
Bitcoin Rainbow Price Chart Indicator
Uses color bands overlaid on a log growth curve to highlight market stages.

Bitcoin Cycle MasterNew
A combination of on-chain metrics including Coin Value Days Destroyed and Terminal Price.
Pi Cycle Top & Bottom IndicatorNew
Pi Cycle Top and Bottom Indicator.
Please note, the indicators above are experimental. There is no guarantee certain rules within each model will continue to apply as Bitcoin progresses along its adoption journey. Any information on this site is not to be considered financial advice. Please review the Disclaimer section for more information.