
 Bitcoin: Top Cap
Zoom in with touchscreen: Touch and hold with ONE finger then drag.
Zoom in on desktop: Left click and drag.
Reset: Double click.
Indicator Overview
This indicator uses market cap and price information as inputs. It is therefore not an onchain indicator.
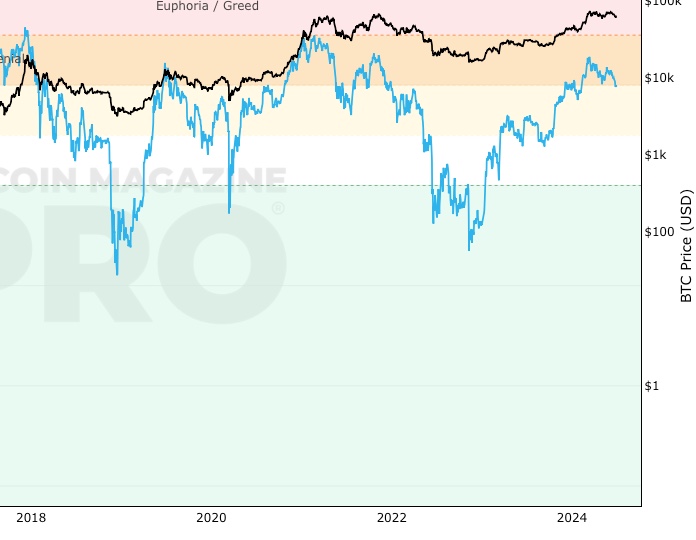
To calculate Top Cap, it is first necessary to calculate Average Cap, which is the cumulative sum of Market Cap divided by the age of the market in days. This creates a constant time-based moving average of market cap.
Once Average cap is calculated, those values are multiplied by 35. The result is Top Cap.
For much of Bitcoin’s history, Top Cap correctly predicted the Bitcoin price high’s of the major cycles where price had gone parabolic due to market euphoria and FOMO (fear of missing out). It failed to do so in 2021 as there was a rounded top to the cycle, not a parabolic top.
Fall Further Down The Rabbit Hole
Top Cap was created by @woonomic.
You May Also Be Interested In
Net Unrealized Profit/Loss (NUPL)
On-chain indicator for investor sentiment market stages
AASI (Active Address Sentiment Indicator)
Comparing change in price with change in number of addresses to determine if Bitcoin is over/undervalued in the short term.
RHODL Ratio
On Chain Indicator using Realized HODL Ratio’s to identify cycle high price tops.
Make smarter decisions about Bitcoin. Instantly.
Access the Bitcoin and Global Macro Charts that really drive Bitcoin’s price.
+40 chart alerts. Never miss critical levels on charts again.
Analysis newsletter. Manage your emotions at market extremes.
Private Tradingview indicators. See Bitcoin chart levels in real time!
Cancel anytime.
Any information on this site is not to be considered as financial advice. Please review the Disclaimer section for more information.