
 Bitcoin: Whale Shadows (aka Revived Supply)
Zoom in with touchscreen: Touch and hold with ONE finger then drag.
Zoom in on desktop: Left click and drag.
Reset: Double click.
Indicator Overview
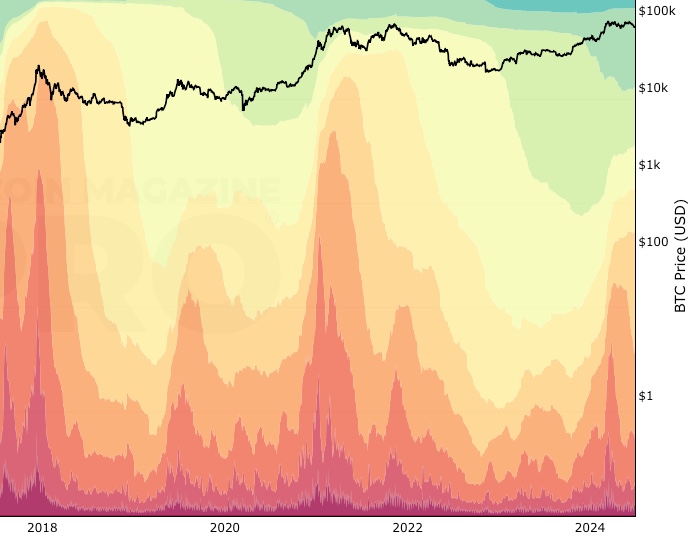
This indicator shows when bitcoins that have not moved onchain for many years, finally move again. The coins are moving from a wallet that they have stayed on for years, to another wallet. Another term that can be used for this is revived supply because after lying dormant, the coins are once again moving on the Bitcoin blockchain.
So for example the 7-9yr data is showing the number of coins that had not previously moved for between 7-9 years, now moving onchain on a particular day.
While we track all movements, on the chart above we only show movements of coins that are greater than 100 bitcoins to reduce the level of noise on the chart.
This bitcoin chart is called Whale Shadows because the term ‘Bitcoin whale’ refers to an individual who holds a large amount of Bitcoin. This chart allows us to see when whales who have held bitcoin in a wallet for a very long time, finally move their coins again. So we are able to see significant movements of coins from these very experienced players in the market.
Note: you can select the different age ranges by clicking the labels underneath the chart.
Price Prediction Using This Tool
While not intended to be used as a price prediction or forecasting tool, it is interesting to note that we have historically seen large whale transactions occurring at major price highs. This is likely because these more experienced players in the space who have accumulated many bitcoins, have a greater understanding than the average participant as to when the market may be overheated. These whales are sometimes referred to as ‘smart money’.
For this reason, it can be very useful to track their activity over time and monitor when a large number of previously dormant coins move on a given day. That is why we like to call this the ‘whale shadows’ chart!
Date Created
January 2022
You May Also Be Interested In
Short Term Holder Supply
Circulating bitcoin supply that is held by short term holders.
1+ Year HODL Wave
View of the percentage of coins HODL'd on the blockchain for over 1 year.
Realized Cap HODL Waves
The cost basis of UTXO’s held within specific age bands.
Make smarter decisions about Bitcoin. Instantly.
Access the Bitcoin and Global Macro Charts that really drive Bitcoin’s price.
+40 chart alerts. Never miss critical levels on charts again.
Analysis newsletter. Manage your emotions at market extremes.
Private Tradingview indicators. See Bitcoin chart levels in real time!
Cancel anytime.
Any information on this site is not to be considered as financial advice. Please review the Disclaimer section for more information.