
 Bitcoin: Bitcoin Profitable Days
Zoom in with touchscreen: Touch and hold with ONE finger then drag.
Zoom in on desktop: Left click and drag.
Reset: Double click.
Indicator Overview
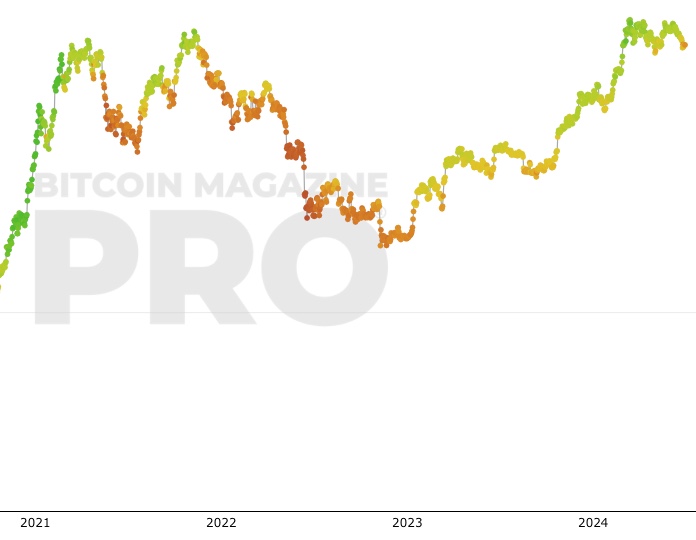
Number of days in Bitcoin's traded history where holding Bitcoin has been profitable relative to today's price.
This chart highlights the aggressive growth of Bitcoin's adoption curve over time, which is reflected in its price. Because supply is limited, as demand grows price moves up.
For investors, it also demonstrates the importance of understanding the market cycles of Bitcoin to avoid buying market cycle tops. The drawdowns from cycle tops can last a long time, around 2-3 years in previous cycles.
Bitcoin Price Prediction Using This Tool
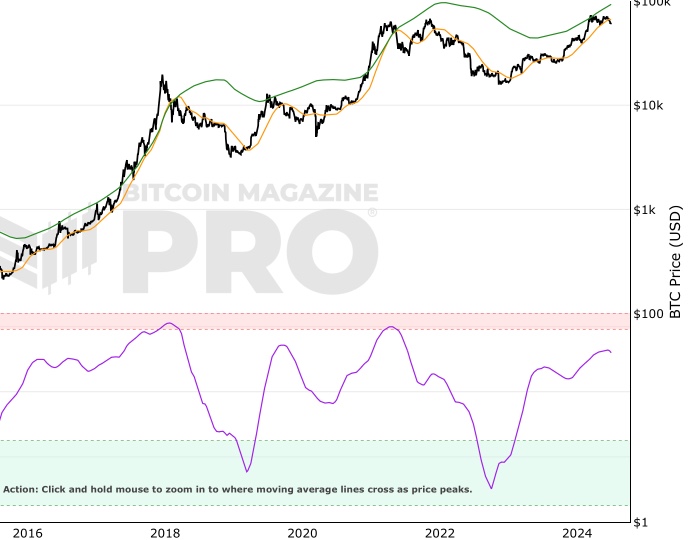
This indicator demonstrates how Bitcoin price has accelerated over its lifetime as it becomes adopted by more and more people around the world. For people trying to understand where the price of Bitcoin may go in the future and try and predict the price of Bitcoin, it pays to understand whether adoption and interest is likely to increase further over time.
This tool shows how people who have simply held Bitcoin on a long enough time horizon have been rewarded by Bitcoins adoption over time.
Created By
@Rhythmtrader
Date Created
August 2019
Fall Further Down The Rabbit Hole
Follow @Rhythmtrader on Twitter.
You May Also Be Interested In
Fear And Greed Index
Market sentiment tool gauging investor fear and greed over time.
Pi Cycle Top & Bottom Indicator
Pi Cycle Top and Bottom Indicator.
Stock-to-Flow Model
Ratio of bitcoins in circulation relative to the amount of bitcoins annually mined, and this ratio's relationship with price
Make smarter decisions about Bitcoin. Instantly.
Access the Bitcoin and Global Macro Charts that really drive Bitcoin’s price.
+40 chart alerts. Never miss critical levels on charts again.
Analysis newsletter. Manage your emotions at market extremes.
Private Tradingview indicators. See Bitcoin chart levels in real time!
Cancel anytime.
Any information on this site is not to be considered as financial advice. Please review the Disclaimer section for more information.