What Does The Bear Case Look Like For Bitcoin?
18 de septiembre de 2026
Author: Matt - Director of Research & Analytics
Price action has looked pretty positive recently, but I'll be honest, there's a credible argument that this is just a bear market rally. So this week I'm going to lay out the bear case as fairly as I can, without reaching for the bullish data to wave it away, and then tell you where I think we are.
What the data tells us:
- Bitcoin never reached CVDD, Realized Price, Balanced Price or the Long-Term Holder Realized Price this bear market, and never gave an entry signal on MVRV-Z or NUPL.
- A new hiking cycle has begun, yet yields are still rising, CPI and PPI have turned back up, and oil is above $100.
- Risk appetite in traditional markets has collapsed, with high-yield credit breaking down out of the triangle we'd been watching.
- Bitcoin has just been rejected from the 365-day moving average, the line that has historically separated bull from bear.
- My take is that the bears have genuine arguments, but this rally is structurally different to previous failed ones.
The Signals That Never Fired
Was this the shallowest and shortest bear market Bitcoin has ever had? Possibly, and that's part of the problem. Every reliable bottom signal we lean on failed to fire. Price never reached CVDD, which has been hit in every previous bear market, and never touched the Realized Price, Balanced Price or Long-Term Holder Realized Price either. Neither MVRV-Z nor NUPL gave an entry signal. Saying "this time is different" while claiming to be data-driven is a bit rich, and the bears are right to point that out.

Figure 1: Bitcoin has not touched CVDD this bear market.
The rally to $80,000 is also still a lower high, and the Realized Price actually fell during it while the Short-Term Holder Realized Price kept climbing. Some investors who accumulated at higher prices are treating the bounce as a get-out-of-jail-free card, rather than new speculators piling in. The recent ETF outflows tell the same story.
Yields, Hikes And Oil
On the macro side, we've just started a new hiking cycle, and the market is already pricing in more. The hike hasn't slowed Treasury Yields, which have kept climbing and will put real strain on interest repayments.
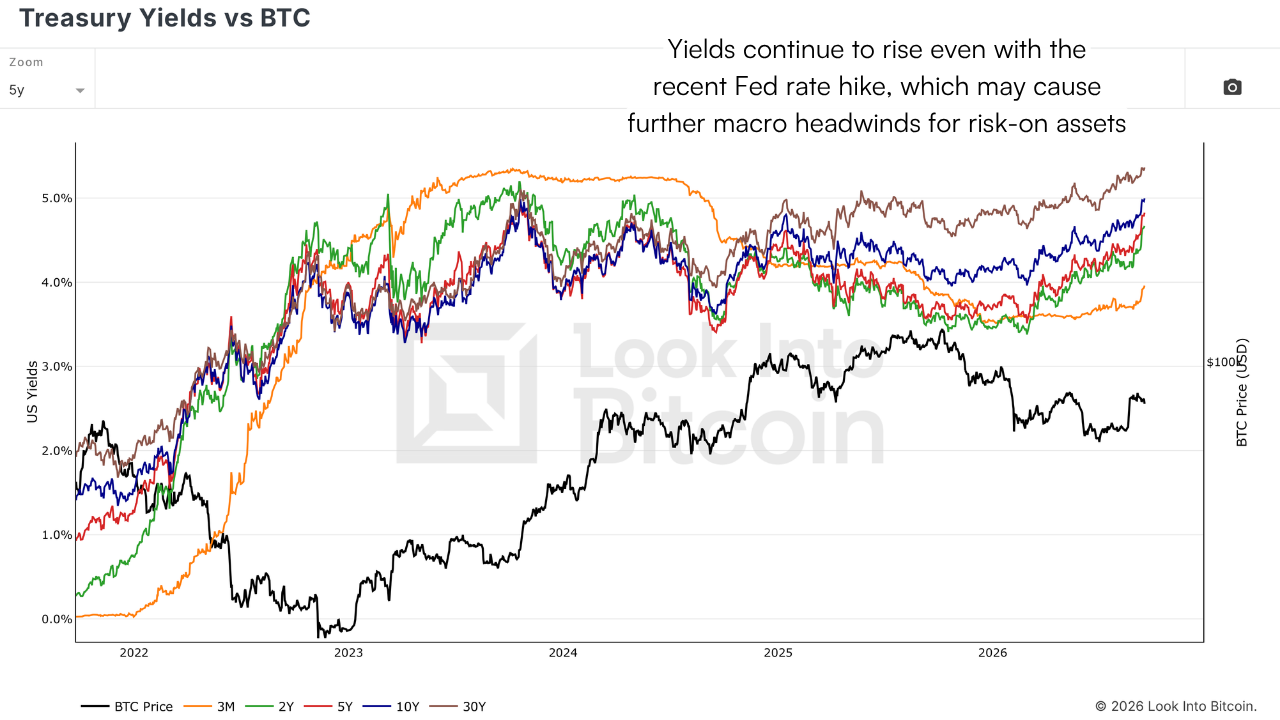
Figure 2: US Treasury yields continue to rise even after the latest rate hike.
CPI and PPI were easing in June and July, as Bitcoin put in its $58,000 low, but have turned back up through August and September, and oil is still above $100 a barrel despite a recent rejection. ISM PMI, which had been recovering through June and July, has started falling again. Add a Clarity Act that's been pushed back and a DXY testing resistance, and it's not a comfortable backdrop.
Risk Appetite Has Vanished
High-yield corporate bonds are a decent gauge of appetite for speculative assets, and right now that appetite has gone. We'd been watching a triangle form in this data for months, hoping for a break to the upside; it broke down instead...
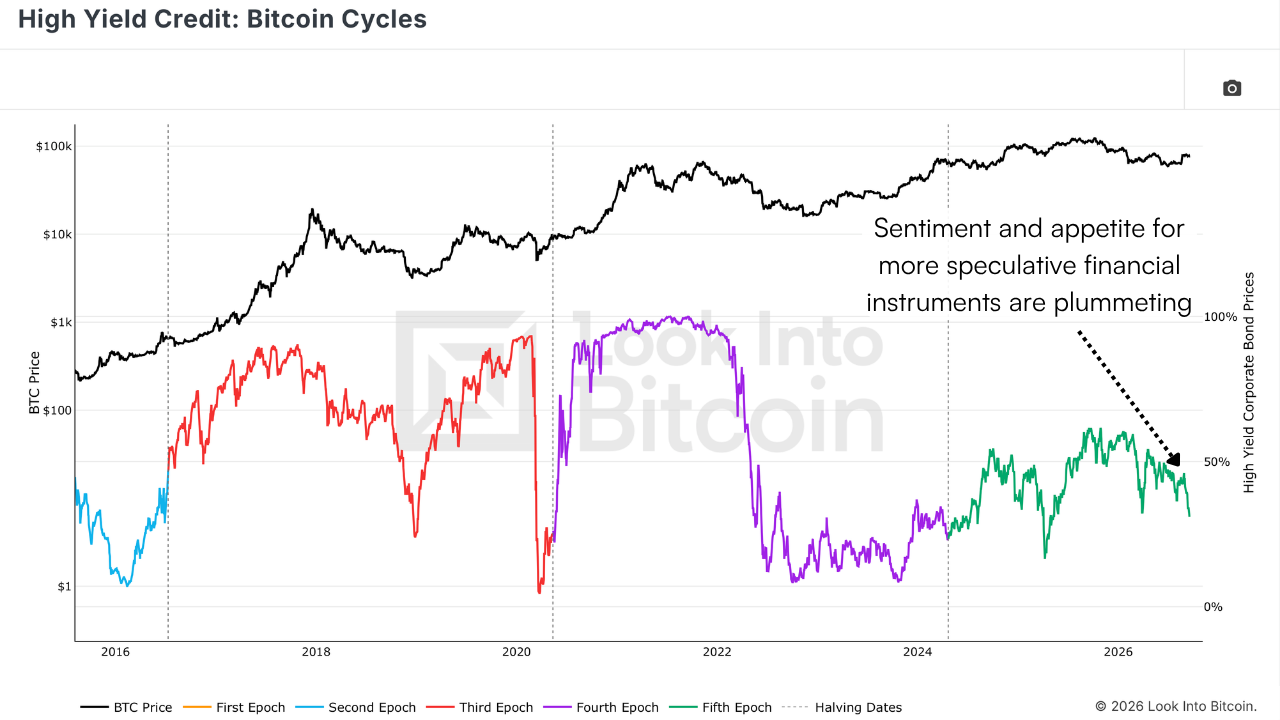
Figure 3: The appetite for speculative financial instruments is plummeting.
Too Calm
The Financial Stress Index is low, which sounds good until you look at the comparable moments. Similarly low readings coincided with a bull market peak, a bear market rally, a peak just before a 50% drop, the post-ETF top at $74,000 that preceded months of chop, the current all-time high, and now this run to $80,000. Calmer markets haven't tended to precede good things for Bitcoin.

Figure 4: The current levels in the Financial Stress Index have rarely lasted long.
Positioning hasn't helped either. Bear market lows usually come with heavily negative Bitcoin Funding Rates as traders bet on more downside; this time they've stayed eerily positive throughout, which to me reads as people trying to catch the knife the whole way down. Max pain on Deribit sits at $72,000. And the Bitcoin Hash Rate is in the longest drawdown of the ASIC era, with miners now able to pivot into AI infrastructure rather than wait for Bitcoin to recover.
The Defining Line
Bitcoin has just been rejected from the 365 Day Moving Average. This is the line I've stood by for years as the difference between a bull and a bear market. I was vocal through the last bull market that we hadn't broken it, and I flipped bearish the moment we did. We tested it from beneath in the 2022 bear market before making lower lows and in 2015 to 2016 before that.
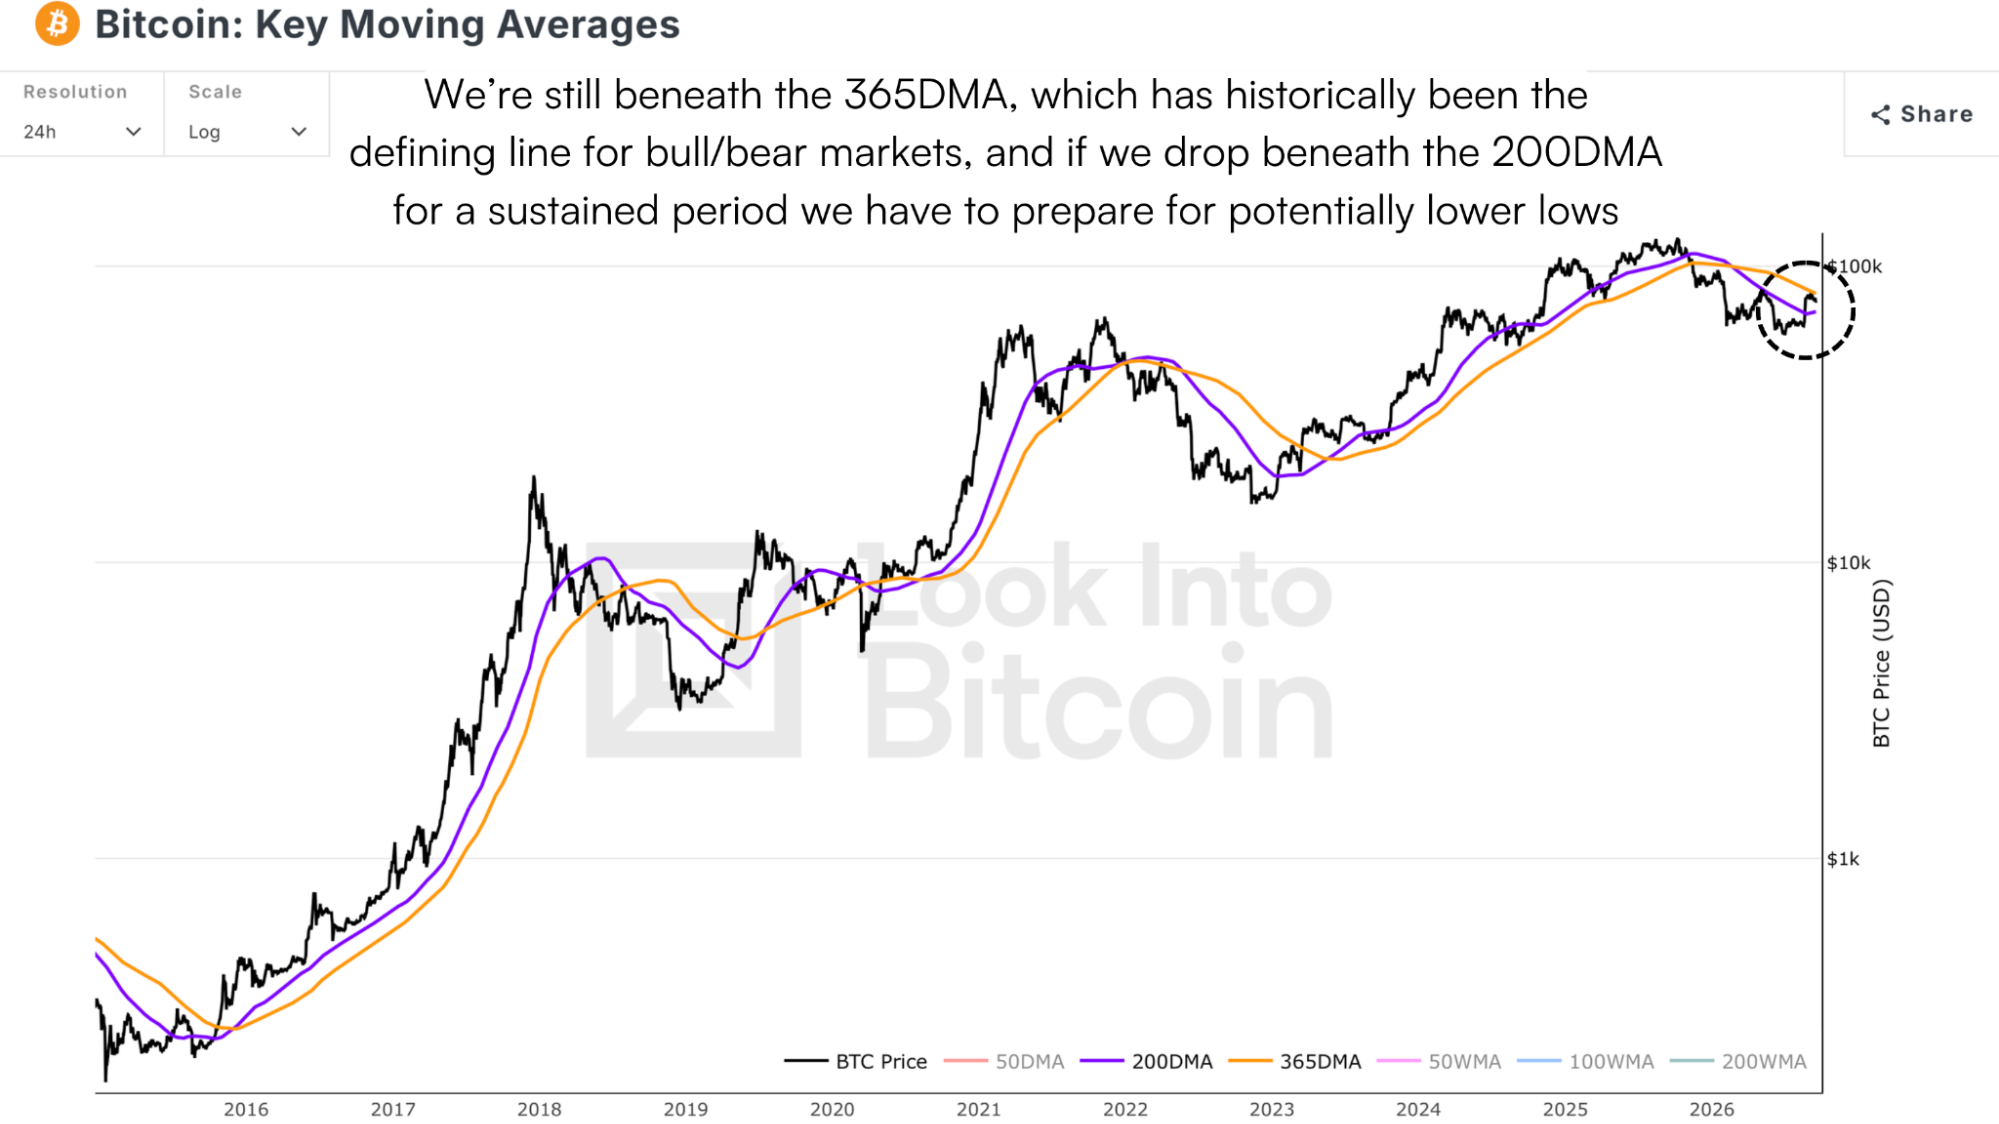
Figure 5: Bitcoin price is back beneath the 365DMA for the first time since 2022.
What would break my bull thesis is losing the previous all-time high around $70,000, the 200-day moving average and the Short-Term Holder Realized Price, all of which are converging with a rising 200-week moving average over the coming weeks. Dip into that zone and it's squeaky bum time. Break beneath it and it's very hard to argue against new lows.
So, Where Are We?
Here's why I'm still on the other side of it... Every previous rejection from the 365-day came while price was beneath the 200-day and the Short-Term Holder Realized Price. This time we reclaimed both first, then pushed into obvious resistance. Overlay the rally off the 2022 lows, and the two look very similar. Price also rose with the Clarity Act failure, and the hike went from likely to certain, which is not what fresh selling looks like. I still think the balance of the evidence still says the lows are in; it's just worth playing devil's advocate to your own analysis occasionally! Thanks for reading and have a lovely weekend.
Watch our most recent YouTube video here:
Bitcoin: What Would Prove The Bulls (Me) Wrong
Research Director
La información contenida en este sitio no debe considerarse asesoramiento financiero. Por favor revise la Descargo de responsabilidad para más información.