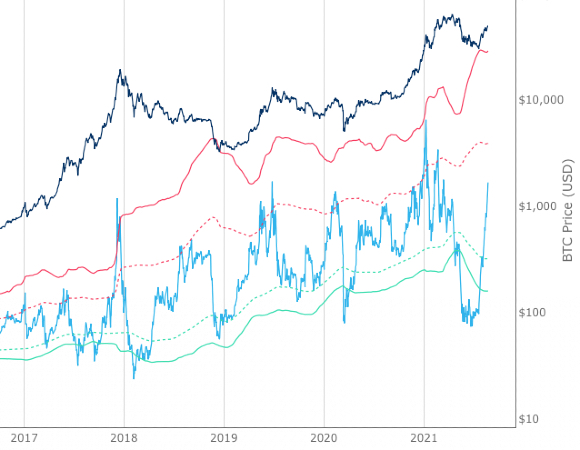
 Bitcoin: Spent Output Profit Ratio (SOPR)
Acercarse con la pantalla táctil: Toca y mantén con UN dedo y luego arrastra.
Acercarse al escritorio: Haz clic con el botón izquierdo y arrastra.
Reiniciar: Doble clic.
What is SOPR?
Spent Output Profit Ratio (SOPR) tracks the profit level of all moved bitcoins during a given period. It indicates whether sellers are in profit or loss when their transaction takes place on the blockchain.
Note, there is an assumption that when coins move they are being sold. This is not always the case as an individual could be moving them from one address to another address they own.
For this metric, we assume anyone moving coins on-chain is a ‘seller’. While not perfect it is a reasonable proxy when aggregated to show whether coins are moving at a ‘profit’ or a ‘loss’ during the allocated period.
How is SOPR calculated?
Spent Output Profit Ratio (SOPR) looks at the ratio between the US Dollar value when the UTXO was created and the US Dollar value when the UTXO is spent.
A UTXO is an Unspent Transaction Output, it refers to the balance in a bitcoin address.
By conducting on-chain analysis, we can observe whether outgoing transactions from a wallet are in profit or loss. Aggregating this data within a specific timeframe allows us to generate the data that goes into visualizing the Spent Output Profit Ratio (SOPR) chart above.
SOPR above 0 = coins moved between wallets during that period are in profit overall.
SOPR below 0 = coins moved between wallets during that period are ‘being sold’ at a loss.
SOPR trending up = suggests an increasing level of realized profits over the time period where the upward trend is being noted.
SOPR trending down = suggests a fall in realized profits over the time period where the downtrend is being noted.
Why is SOPR useful?
Spent Output Profit Ratio (SOPR) is useful because it provides a snapshot of actual market participant behavior during a specific period. It can therefore act as a useful market sentiment tool.
If significant losses are realized (i.e. SOPR is negative) and those losses increase over time, then that tells us that market participants are fearful and expect the price of Bitcoin to drop further.
In Bitcoin bull markets, such periods can be opportunistic times to buy for the astute investor, depending on other supporting data points.
Who Created SOPR?
Spent Output Profit Ratio (SOPR) was first created by Renato Shirakashi. You can follow him on Twitter here: @renato_shira
También puedes estar interesado en
Señal NVT Avanzada
Esta adaptación de NVT Signal añade bandas de desviación estándar para identificar cuando Bitcoin está sobrecomprado o sobrevendido.
Indicador de Sentimiento de las Direcciones Activas
Compara el cambio en el precio con el cambio en el número de direcciones activas para determinar si Bitcoin está sobre/infravalorado en el corto plazo.
Percent Addresses in Profit
The Percentage of Bitcoin Addresses in Profit.
Make smarter decisions about Bitcoin. Instantly.
Acceda a los Gráficos Macro Globales y de Bitcoin que realmente impulsan el precio de Bitcoin.
+40 alertas de gráficos. No vuelvas a perderte niveles críticos en los gráficos.
Boletín de análisis. Controle sus emociones en los extremos del mercado.
Indicadores privados de Tradingview. ¡Vea los niveles del gráfico de Bitcoin en tiempo real!
Cancela en cualquier momento.
La información contenida en este sitio no debe considerarse como asesoramiento financiero. Por favor, revise la Sección de exención de responsabilidad para más información.