Bitcoin Shrugs Off A $6.3 Billion Hack
3 de noviembre de 2026
Author: Matt — Director of Research & Analytics
Bitcoin has just been hit with about the most bearish catalyst imaginable, as $6.3 billion is stolen from Binance, the industry’s biggest exchange, in the biggest heist in history.
Alongside it came one of the biggest single-day outflows the ETFs have ever seen. Yet price is down only ~4% on the week. When FTX collapsed in late 2022, Bitcoin fell around 24% in two days. So is this really the time to turn bearish?
The week in four charts:
- The Fear and Greed Index has dropped back into fear following the $6.3 billion Binance hack.
- The ETFs recorded $643 million of outflows in a single day, one of their biggest sell days since launch.
- The share of Bitcoin’s capital in coins held for 1 to 2 years has climbed to around 30%, while speculation remains incredibly low.
- Hash rate continues to climb rapidly despite the hack, and its 30-day average is closing in on its late-2025 high.
The Shock
Unsurprisingly, the Fear and Greed Index has dropped straight back into fear following the $6.3 billion Binance hack. People are fearful, and perhaps rightly so. It’s not a great look for the industry, and anyone who says otherwise is lying.
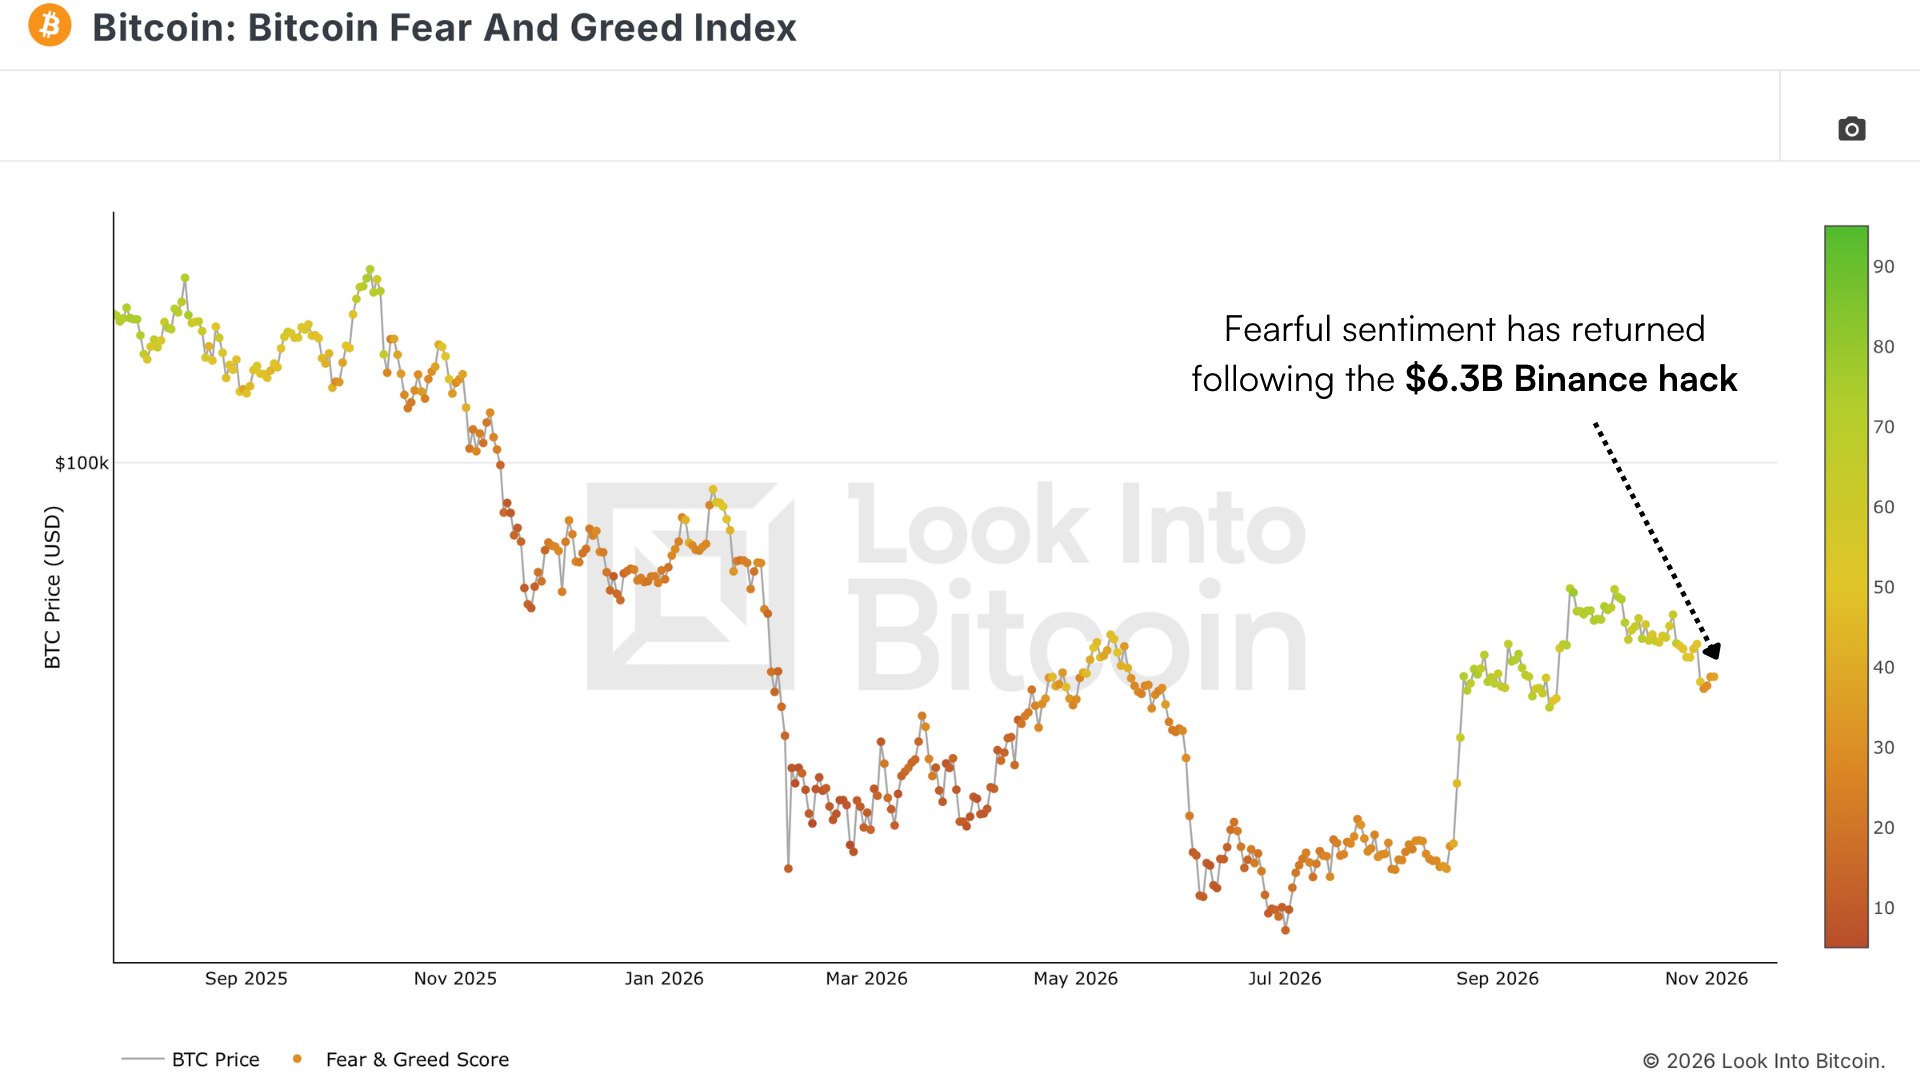
Figure 1: The Fear and Greed Index slips back into fear after the $6.3 billion Binance hack.
There’s been no real panic, though. The Spent Output Profit Ratio (SOPR) shows hardly any realised losses or capitulation, and if you’d told me what had happened, I’d have expected a lot more of both.
ETF holders were less patient. ETF Daily Flows (USD) show $643 million of outflows in a single day, one of the biggest sell days since the ETFs launched.
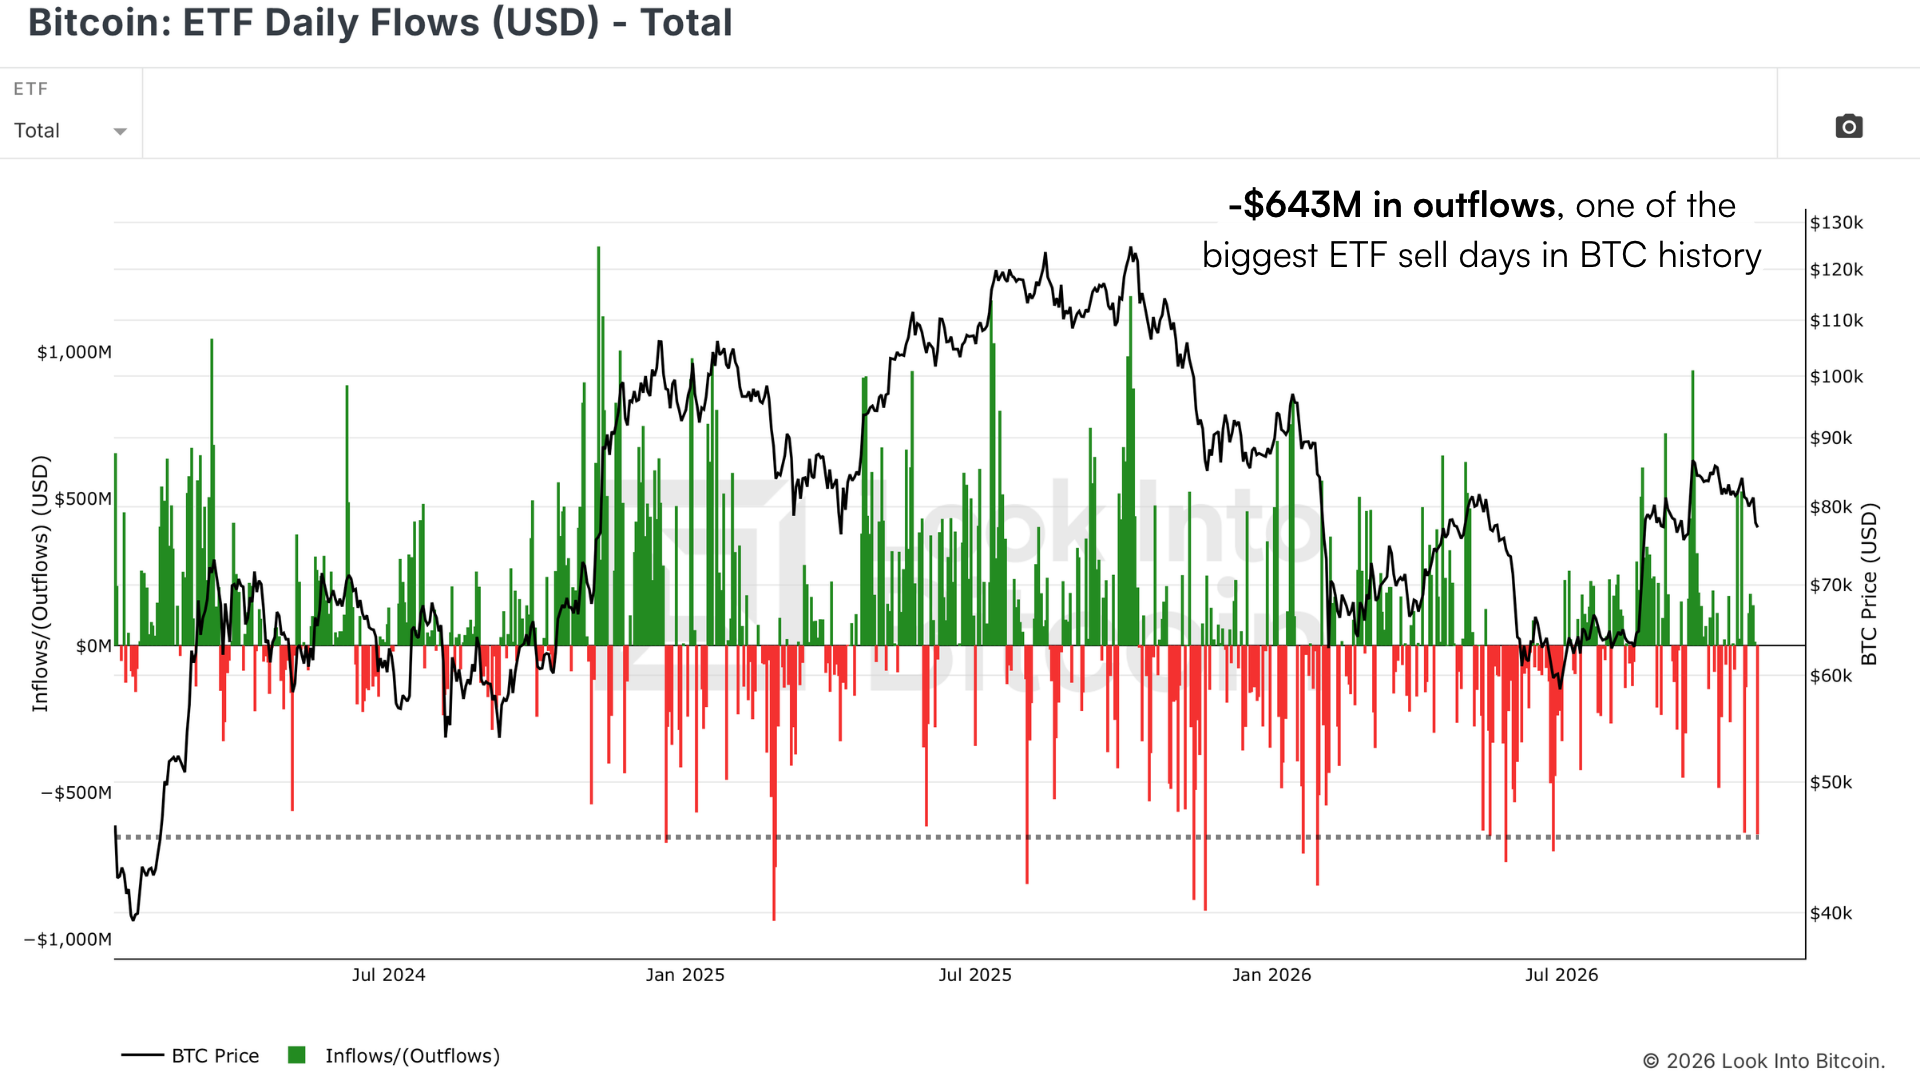
Figure 2: A $643 million outflow ranks among the biggest ETF sell days since launch.
Price has taken it in its stride, bouncing straight off support after a top-to-bottom sell-off of around 6%. That support is where the 1-Year Moving Average and 50-Week Moving Average converge around $76,000 to $77,000, with the Short-Term Holder Realized Price at about $76,000. And with all that we’re still making higher lows, at least for now!
Conviction Holds
On-chain, holders don’t seem to have seen this as their moment to get out. I think it’s reinforced the conviction a lot of people have. On Cycle Capital Flows, the share of Bitcoin’s capital in coins held for 1 to 2 years has climbed to around 30%, while speculation remains incredibly low.
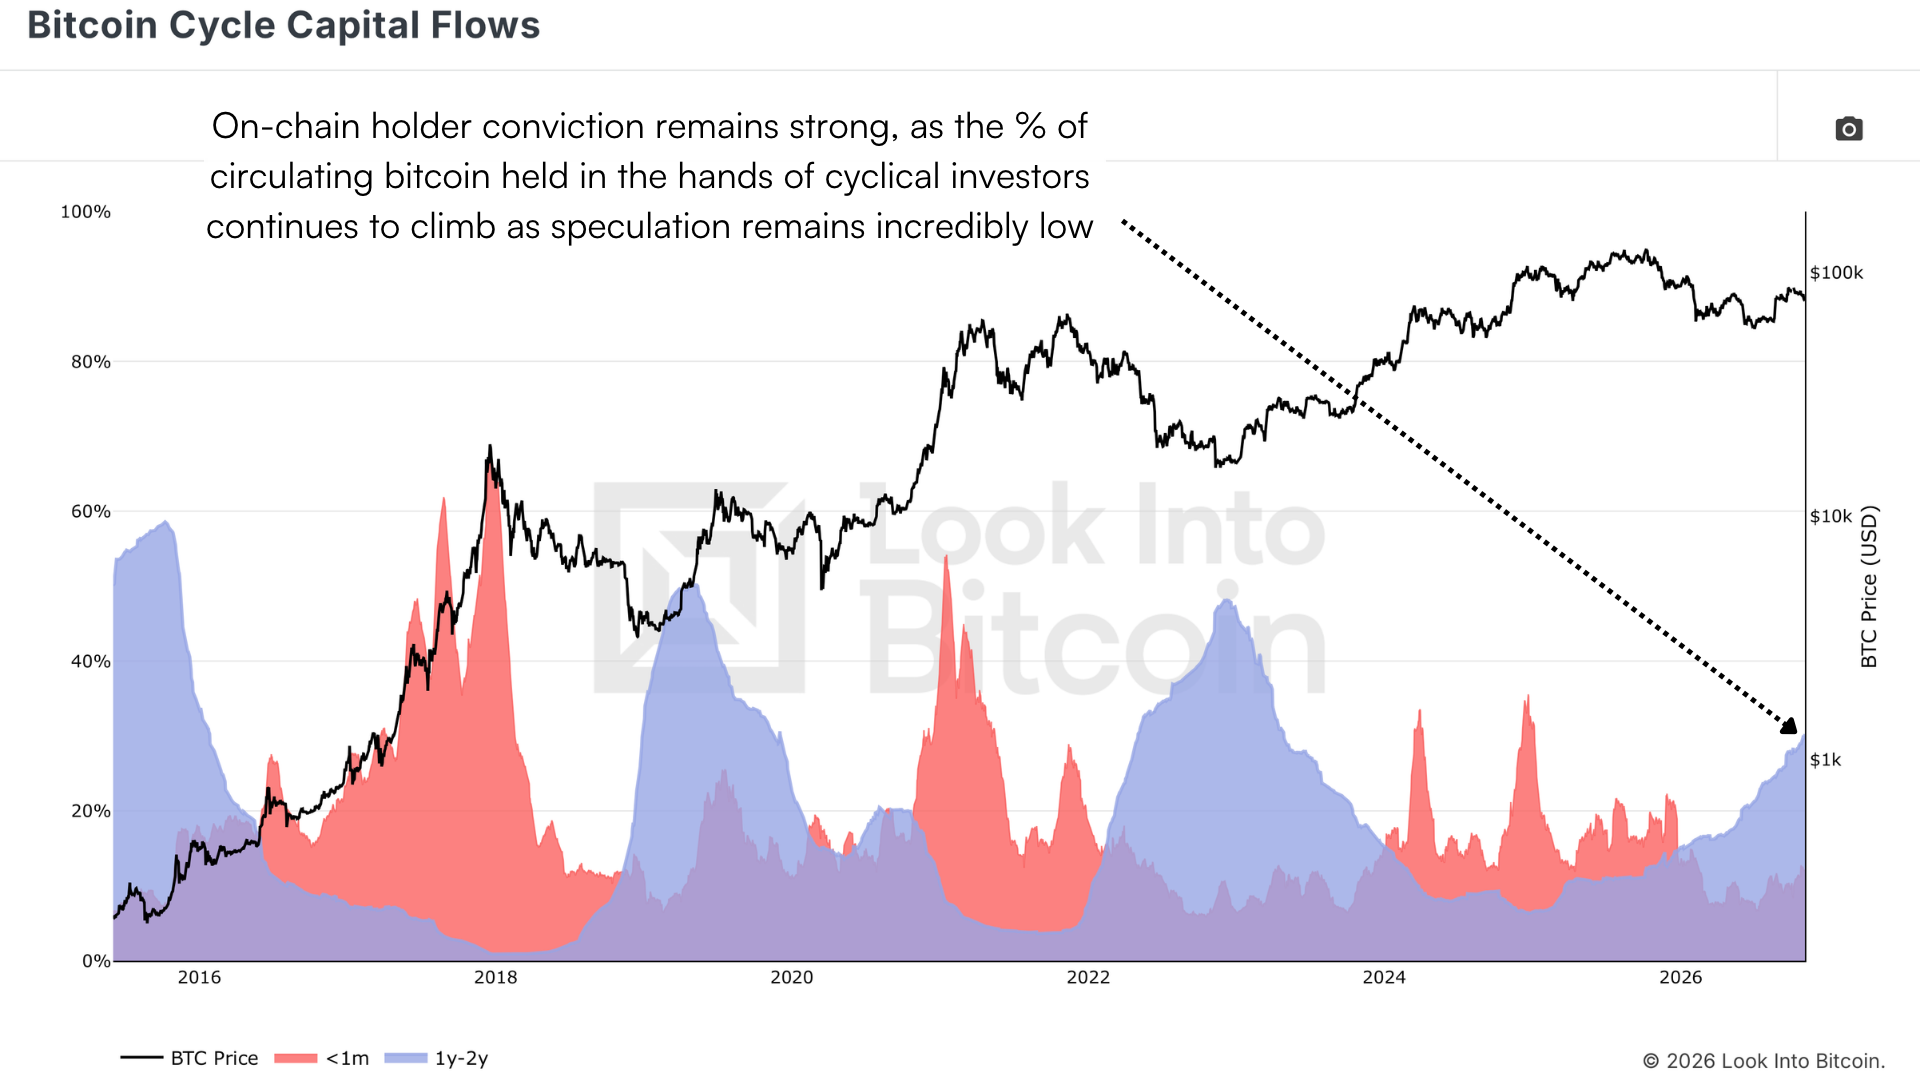
Figure 3: The 1- to 2-year band on Cycle Capital Flows climbs to around 30%.
In previous cycles this band peaked at around 50% or more before experienced holders began distributing to fresh capital, and we haven’t seen that phase yet. This still looks like a healthy, early transition from bear market to bull market.
Miners Dig In
Miners aren’t fleeing either. On the Hash Ribbons Indicator, hash rate continues to climb rapidly in spite of the hack, a sign of renewed confidence and a bullish outlook from miners. The 30-day average has crossed back above the 60-day, a Hash Ribbons buy signal, and is closing in on its late-2025 high.
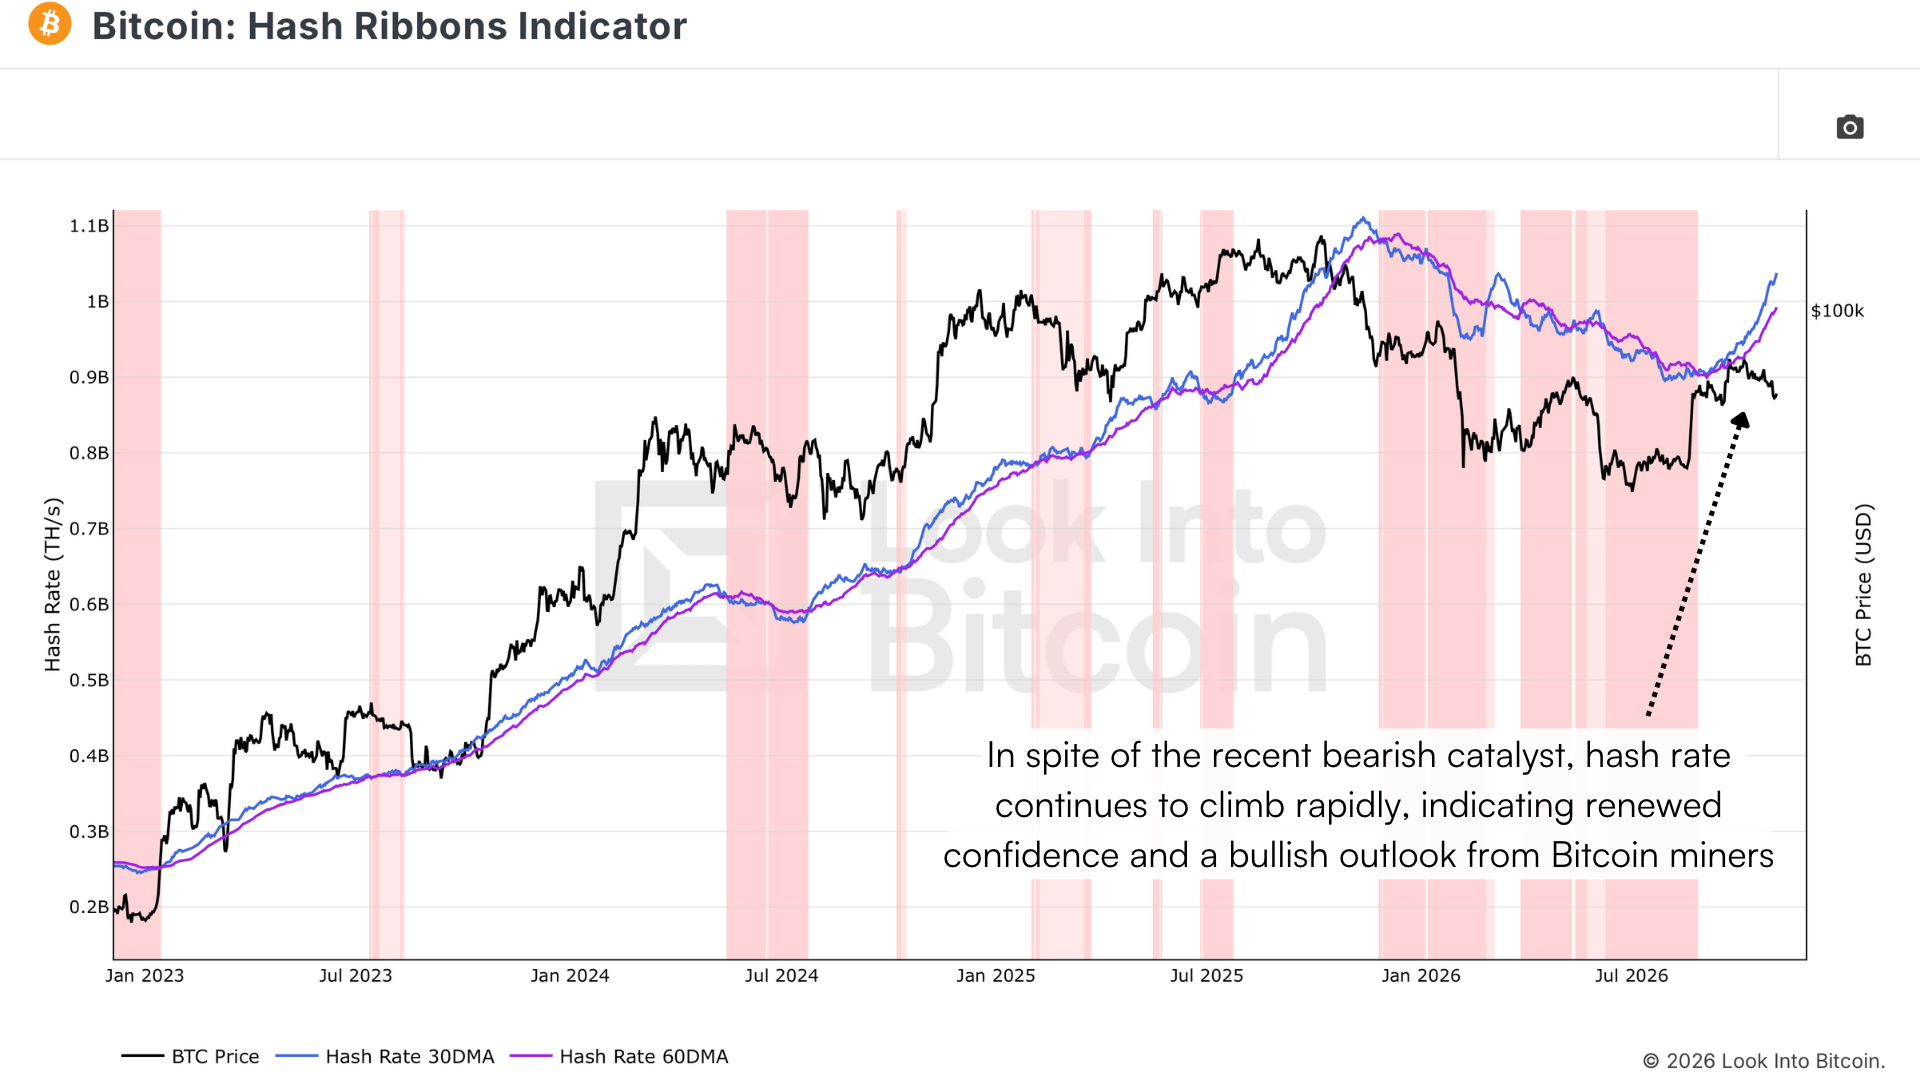
Figure 4: Hash rate’s 30-day average rises above its 60-day and heads back towards its high.
That comes after one of the longest miner downturns we’ve seen, and network activity agrees. The AASI (Active Address Sentiment Indicator) has just flashed a buy signal, and these have historically marked fairly good times to accumulate Bitcoin.
Barely A Blip
Looking at the past month’s chart without the news, I’d never have guessed the industry’s biggest exchange had just been hacked. It’s barely a blip, and Bitcoin is still outperforming gold. Could we drop to $70,000? Of course. But I think the downside is somewhat exhausted, and this much seller exhaustion and relative strength makes for an asymmetric opportunity that shouldn’t be wasted.
Subscribe to the Look Into Bitcoin Substack for more research throughout the week.
For more on this, watch our recent YouTube video here:
Did the Binance Hack Break Bitcoin’s Recovery?
Have a lovely week, and I’ll see you in the next one!
Research Director
La información contenida en este sitio no debe considerarse asesoramiento financiero. Por favor revise la Descargo de responsabilidad para más información.