Bull Market Fever
2 de octubre de 2026
Author: Matt - Director of Research & Analytics
Unfortunately, I seem to be coming down with something… Bitcoin has gone from around $58,000 to over $87,000 in less than three months, and I think it might be bull market fever. We've spent most of the year talking about capitulation, so it's quite nice to have a different diagnosis. But if you're watching this rally thinking you've missed the boat, the long-term holder data suggests we could still be very early.
The short version:
- Long-term holder supply has fallen by roughly 370,000 BTC since its recent peak, alongside a price rally of ~50%.
- Long-term holders recently held over 83% of circulating supply, the highest share on record.
- Cumulative long-term holder distribution is at 3.16%, around 8.5% of the level reached near previous bull market peaks.
- A hypothetical 500% return from the $58,000 low would put Bitcoin around $348,000, while still falling short of the previous cycle's percentage gain.
New Hands
Long Term Holder Supply peaked at around 16.8 million BTC shortly after Bitcoin bottomed near $58,000. Since then, price has gained close to $30,000, while that supply has declined by only around 370,000 BTC. A fairly small change in holder behaviour has accompanied a pretty substantial move in price.
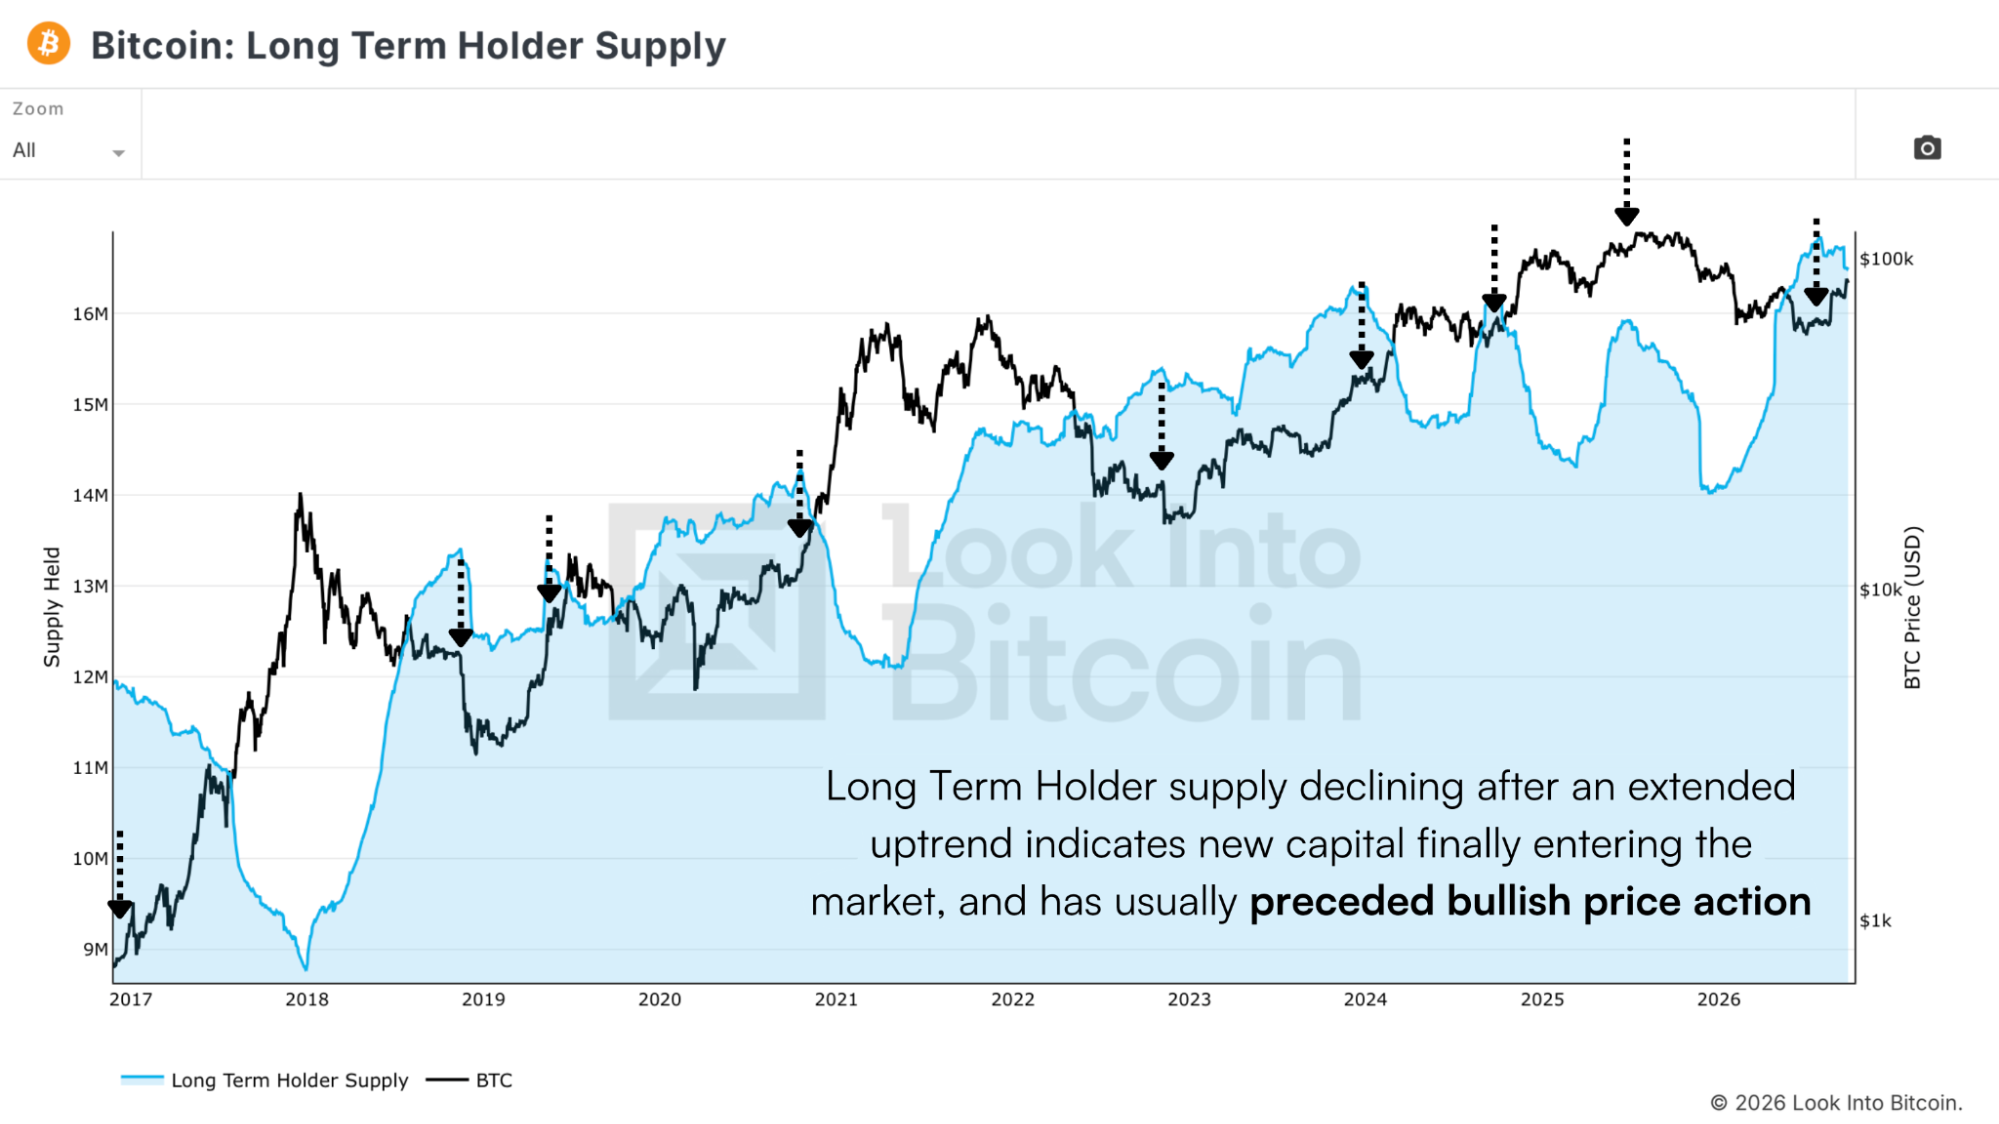
Figure 1: Downturns in Long Term Holder Supply after extended accumulation have often preceded further price gains.
We've looked at this pattern quite a few times. Coins accumulate in the hands of long-term holders through the bear market, then as price recovers, some of those holders begin distributing. Historically, that turnover has often appeared early in the bull market, with considerably more upside still ahead.
Tightly Held
Because Bitcoin's Circulating Supply keeps increasing, it helps to measure long-term holdings as a percentage of the total. On that basis, the recent peak was above 83%, the highest level we've seen. We came out of this bear market with an unusually large proportion of supply sitting in older coins.
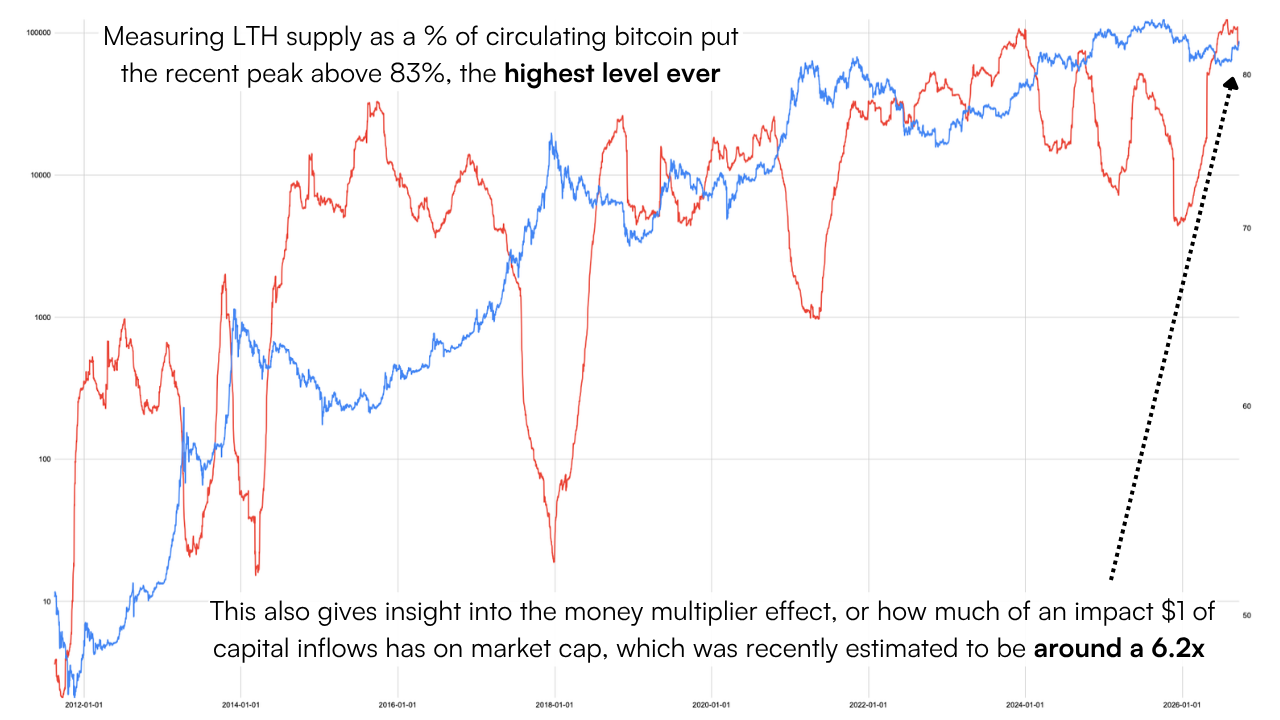
Figure 2: Long-term holder supply reached a peak above 83% of circulating bitcoin.
This is where the money multiplier idea comes in. Bitcoin's market cap doesn't need a dollar of new investment for every dollar it gains. Trades happen in the available supply, and the price they set is then applied to every coin when we calculate market cap. If we assume long-term holdings are largely unavailable to buyers, the smaller remaining pool gives a simple supply-based multiplier estimate, recently around 6.2 times. That is a modelling assumption, rather than a measured promise that each incoming dollar adds exactly $6.20 to Bitcoin's value.
Familiar Behaviour
One of my favourite ways to follow this is to track cumulative long-term holder distribution, resetting the measure for each bull and bear market. Rather than looking only at the latest supply change, we're adding up distribution through each phase to see how far the process has progressed.
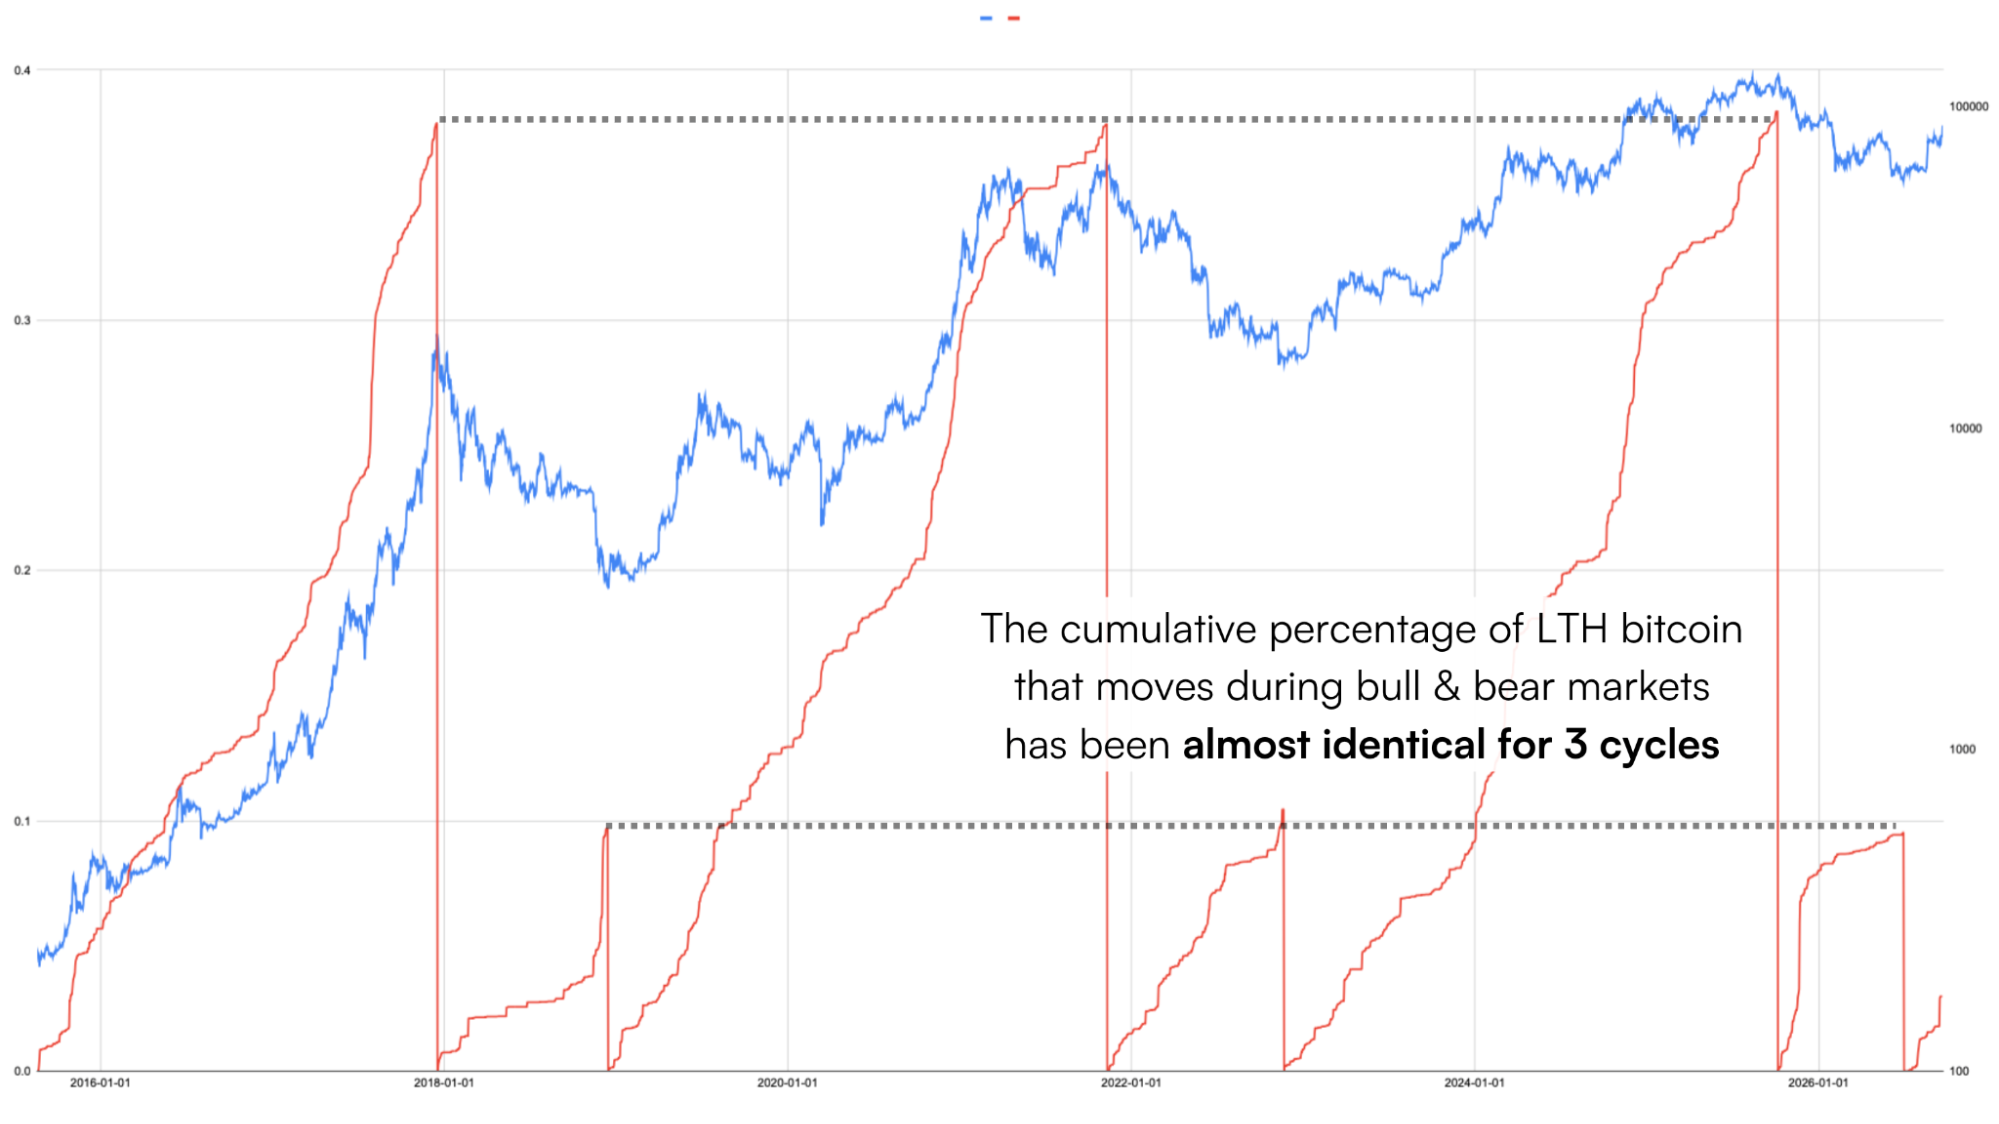
Figure 3: Cumulative long-term holder distribution peaks near 38% in past bull markets.
The last three bull markets reached almost identical cumulative levels around their peaks, and the bear market readings have been closely matched too. For all the changes in Bitcoin over that period, the broad pattern of accumulation and distribution has remained surprisingly familiar.
How Early?
Right now the cumulative reading is just 3.16%. Previous bull markets finished around 37% to 38%, putting us roughly 8.5% of the way towards those historical distribution levels. The current path also sits close to the earlier cycles at a similar number of days from their lows.
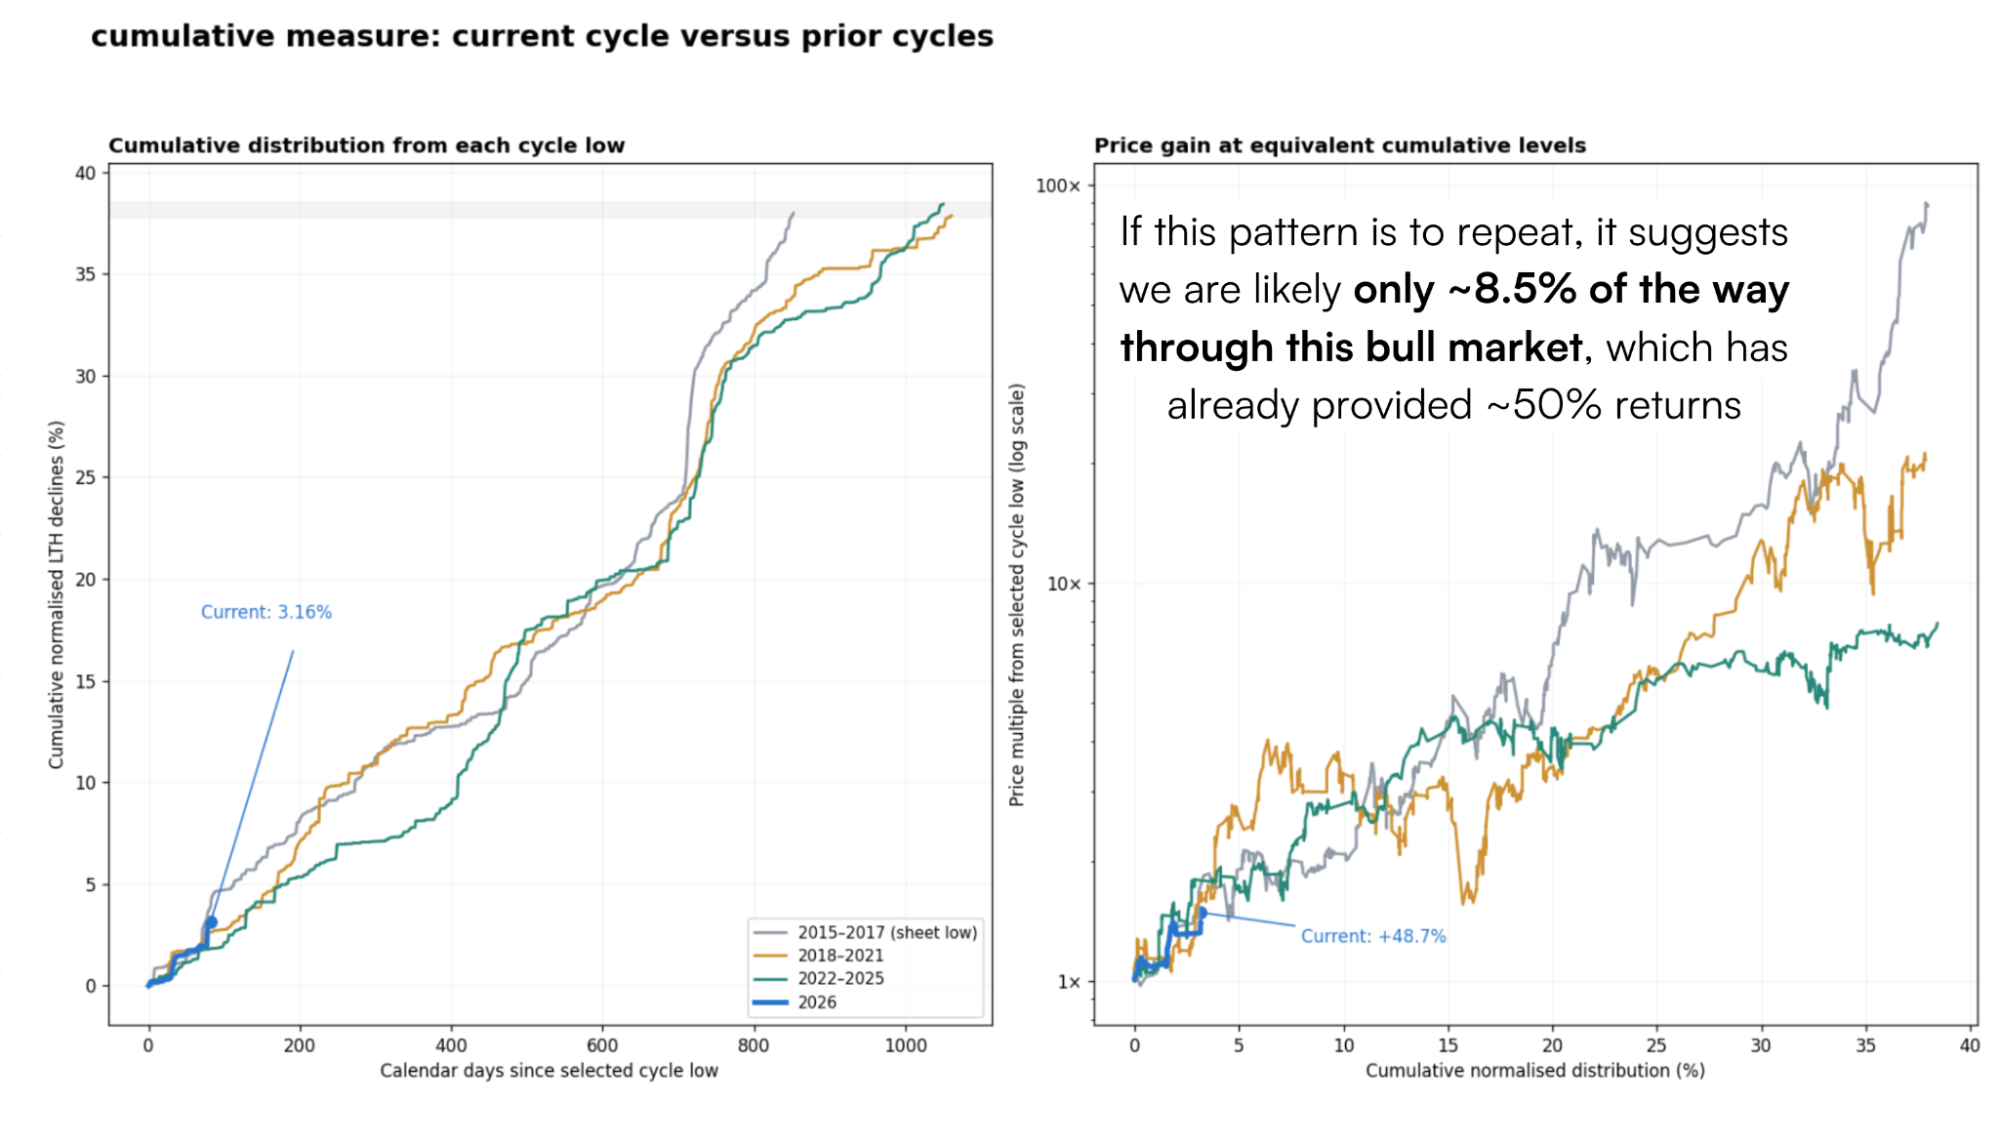
Figure 4: Cumulative distribution sits near 3% after 82 days, with price up ~49%.
That 8.5% refers to the distribution measure. It doesn't mean we can calculate the remaining duration or multiply the price gains by twelve. The roughly 50% return so far is the weakest of the four cycles at the comparable distribution point. Bitcoin is a much larger asset now, and I'm certainly not assuming it owes us a catch-up rally. But diminishing returns still leave room for some fairly big numbers. A 500% gain from a $58,000 low would put Bitcoin around $348,000, compared with the roughly 715% return in the previous bull market.
The Diagnosis
As always, I'd rather react to the data than insist the next cycle finishes at exactly the same level as the last three. If speculation accelerates and long-term holders start distributing much more aggressively, we'll reassess. For now, this looks much closer to the beginning of that process than the end. I think people are still underestimating how quickly it could move if the larger pools of capital really start arriving. Bull market fever permitting, I'll keep watching the data.
Have a lovely week, and I'll see you in the next one.
Watch our most recent YouTube video here:
Bitcoin: How Far Into This Bull Market Are We?
Research Director
La información contenida en este sitio no debe considerarse asesoramiento financiero. Por favor revise la Descargo de responsabilidad para más información.