Bitcoin Volatility Is In The Bottom 1.5% Of Its Entire History
14 de agosto de 2026
Author: Matt - Director of Research & Analytics
Bitcoin Magazine Pro is now Look Into Bitcoin.
Same platform, same team, same subscription: only the name and web address have changed. All old links redirect automatically. You don’t need to do anything differently.
It’s good to be home. Find us at lookintobitcoin.com.
You may notice the charts look a little different this week. We have rebranded back to Look Into Bitcoin, and there is more on that at the end! Price action has been painfully boring for months. Sideways, compressed, going nowhere in particular. That is uncomfortable to sit through, and it is also worth paying attention to, because volatility is every bit as cyclical as price is. By one measure, Bitcoin is currently quieter than it has been on 98.5% of all days in its history.
What the data says this week:
- Weekly Bitcoin volatility has fallen into the bottom 1.48 percentile of its entire history.
- The Bollinger Band Width has only been this compressed a handful of times, and almost all of those occasions resolved into a volatile breakout.
- Across the 13 comparable squeezes since 2011, the median move in the following week was 2.3 times larger than the week before it.
- Over the following quarter, the median breakout move was 50.6%.
- Historically, these squeezes have tended to break upward.
Extreme Compression
Looking at weekly Bitcoin Volatility, it’s currently sitting in the bottom 1.48 percentile of all historical readings. Put another way, roughly 98.5% of Bitcoin's history has been more volatile than right now.
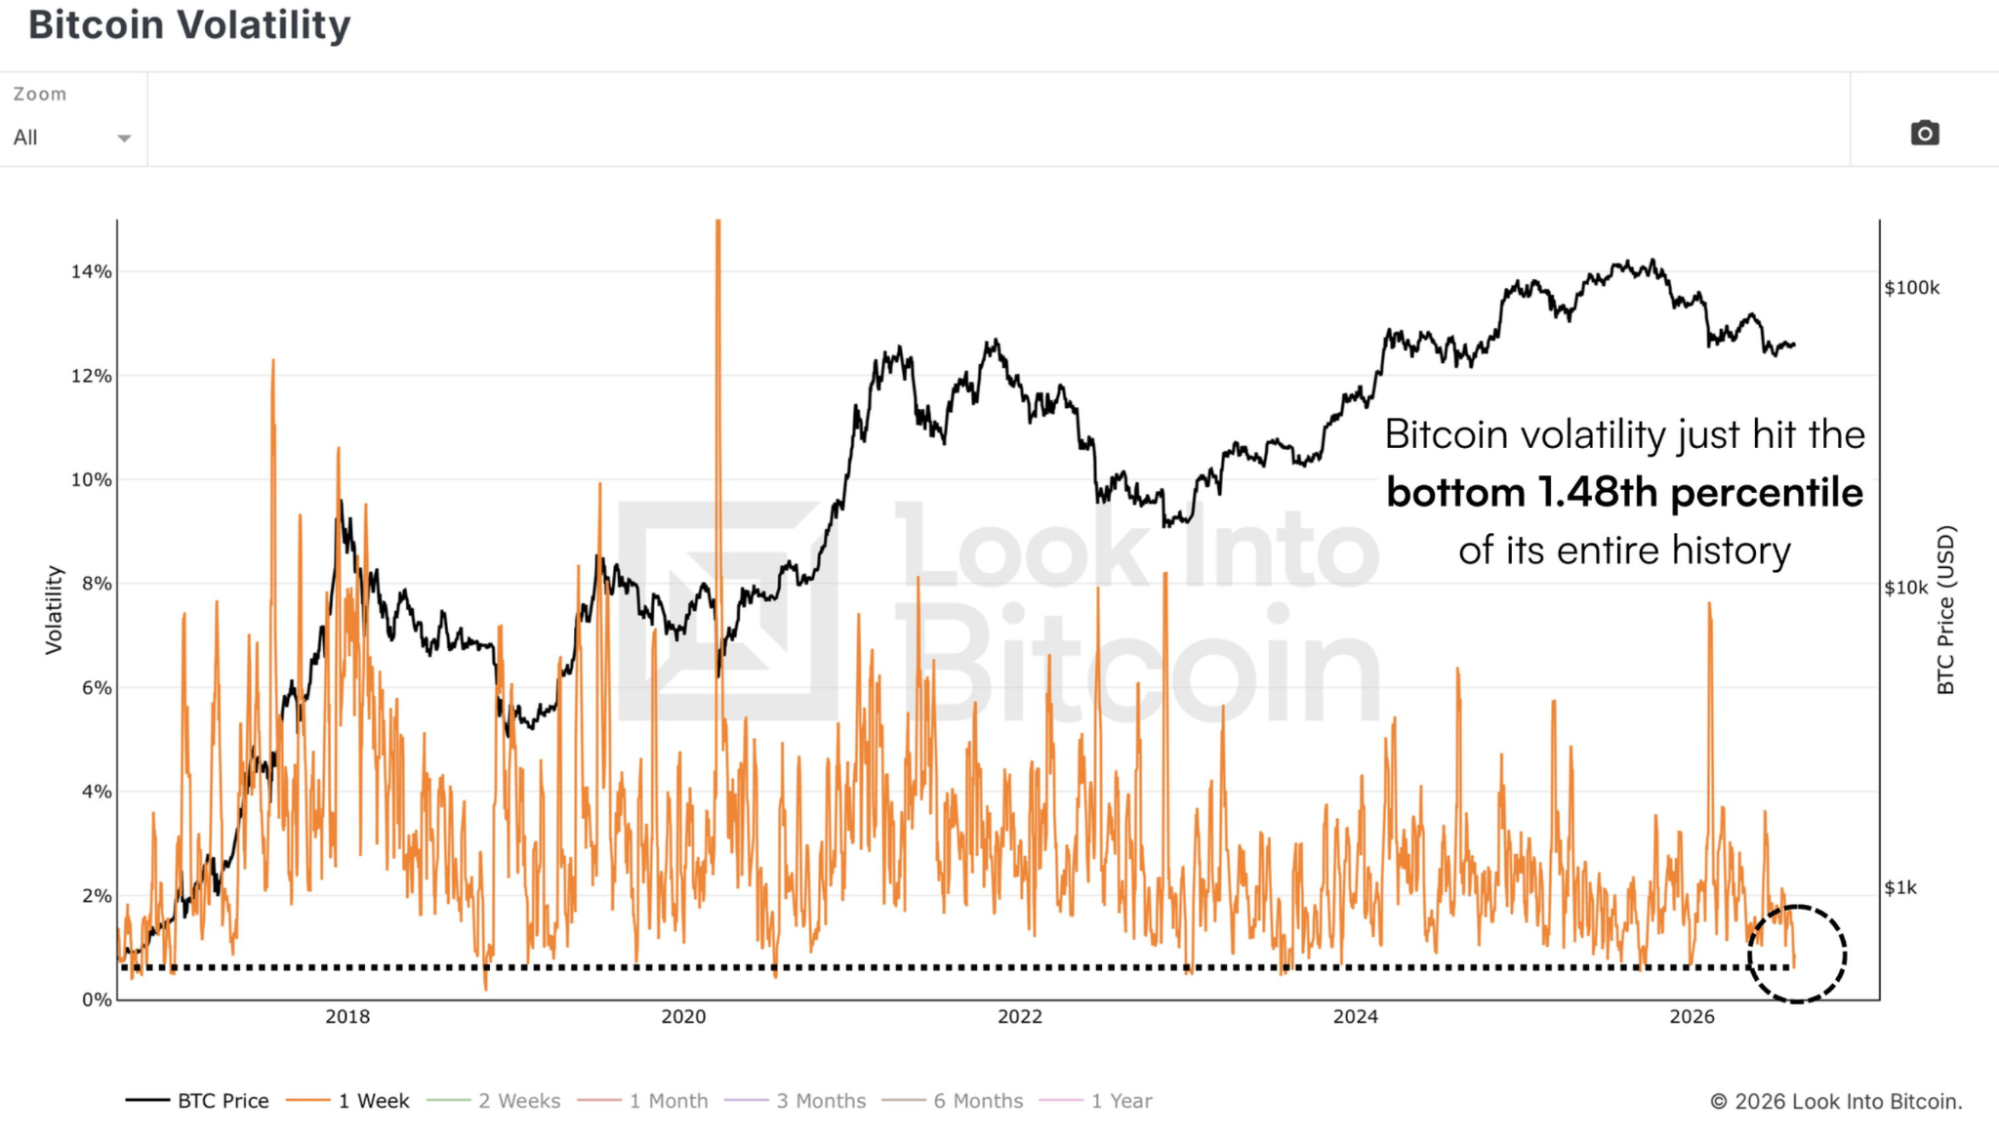
Figure 1: Bitcoin Volatility sits in the bottom 1.48 percentile of its history.
The method behind that number is worth a moment. The reading adapts to Bitcoin's own volatility rather than using a fixed percentage threshold, so quiet periods from 2010 stay comparable to quiet periods today even though the absolute percentage moves back then were far larger. That rules out the obvious objection, which is that Bitcoin has simply matured and calmed down over time. Relative to its own recent behaviour, this is an exceptionally still/boring market.
A Second Look
The same picture appears in a different indicator. Bollinger Bands are a 20-period moving average with two standard deviations plotted either side, and the Band Width measures the distance between the upper and lower bands. When it contracts, price genuinely is not moving much.
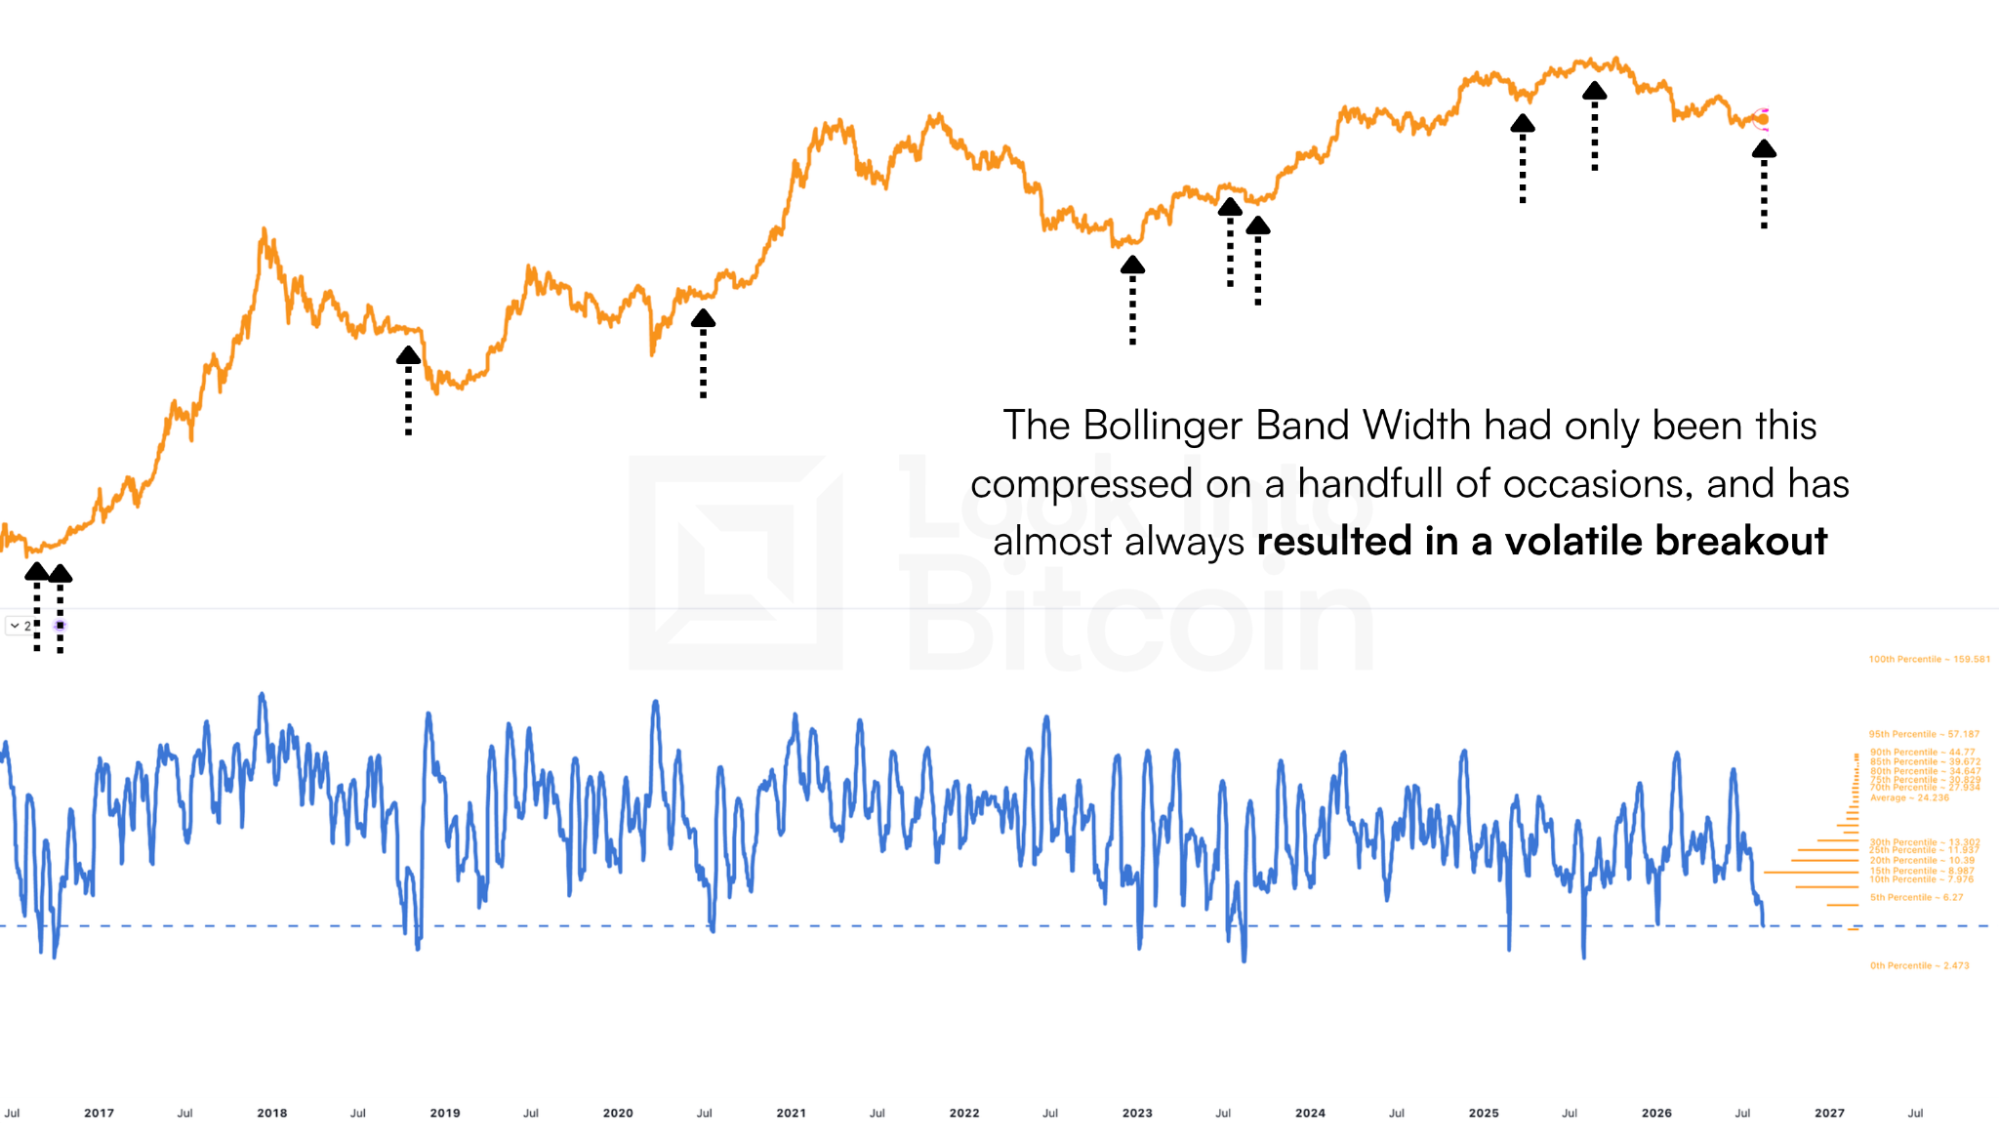
Figure 2: The Bollinger Band Width has compressed to one of its lowest readings on record.
The current reading sits around 4.2. Applying a distribution curve to the full history shows how rare that is. Since 2011, there have been 13 comparable instances, and on the chart the pattern across them is consistent, with extended coils resolving into trending moves.
Next Moves
Rather than eyeballing charts, we measured the median breakout in the period before each squeeze against the period after it. One week before those signals, the median range was 4.3%. One week after, it was 9.9%, a 2.3 times expansion. Over a fortnight, the ratio was 2.2 times, from 5.1% to 11.1%, and over a full quarter, the median range expanded from 30.8% to 50.6%.
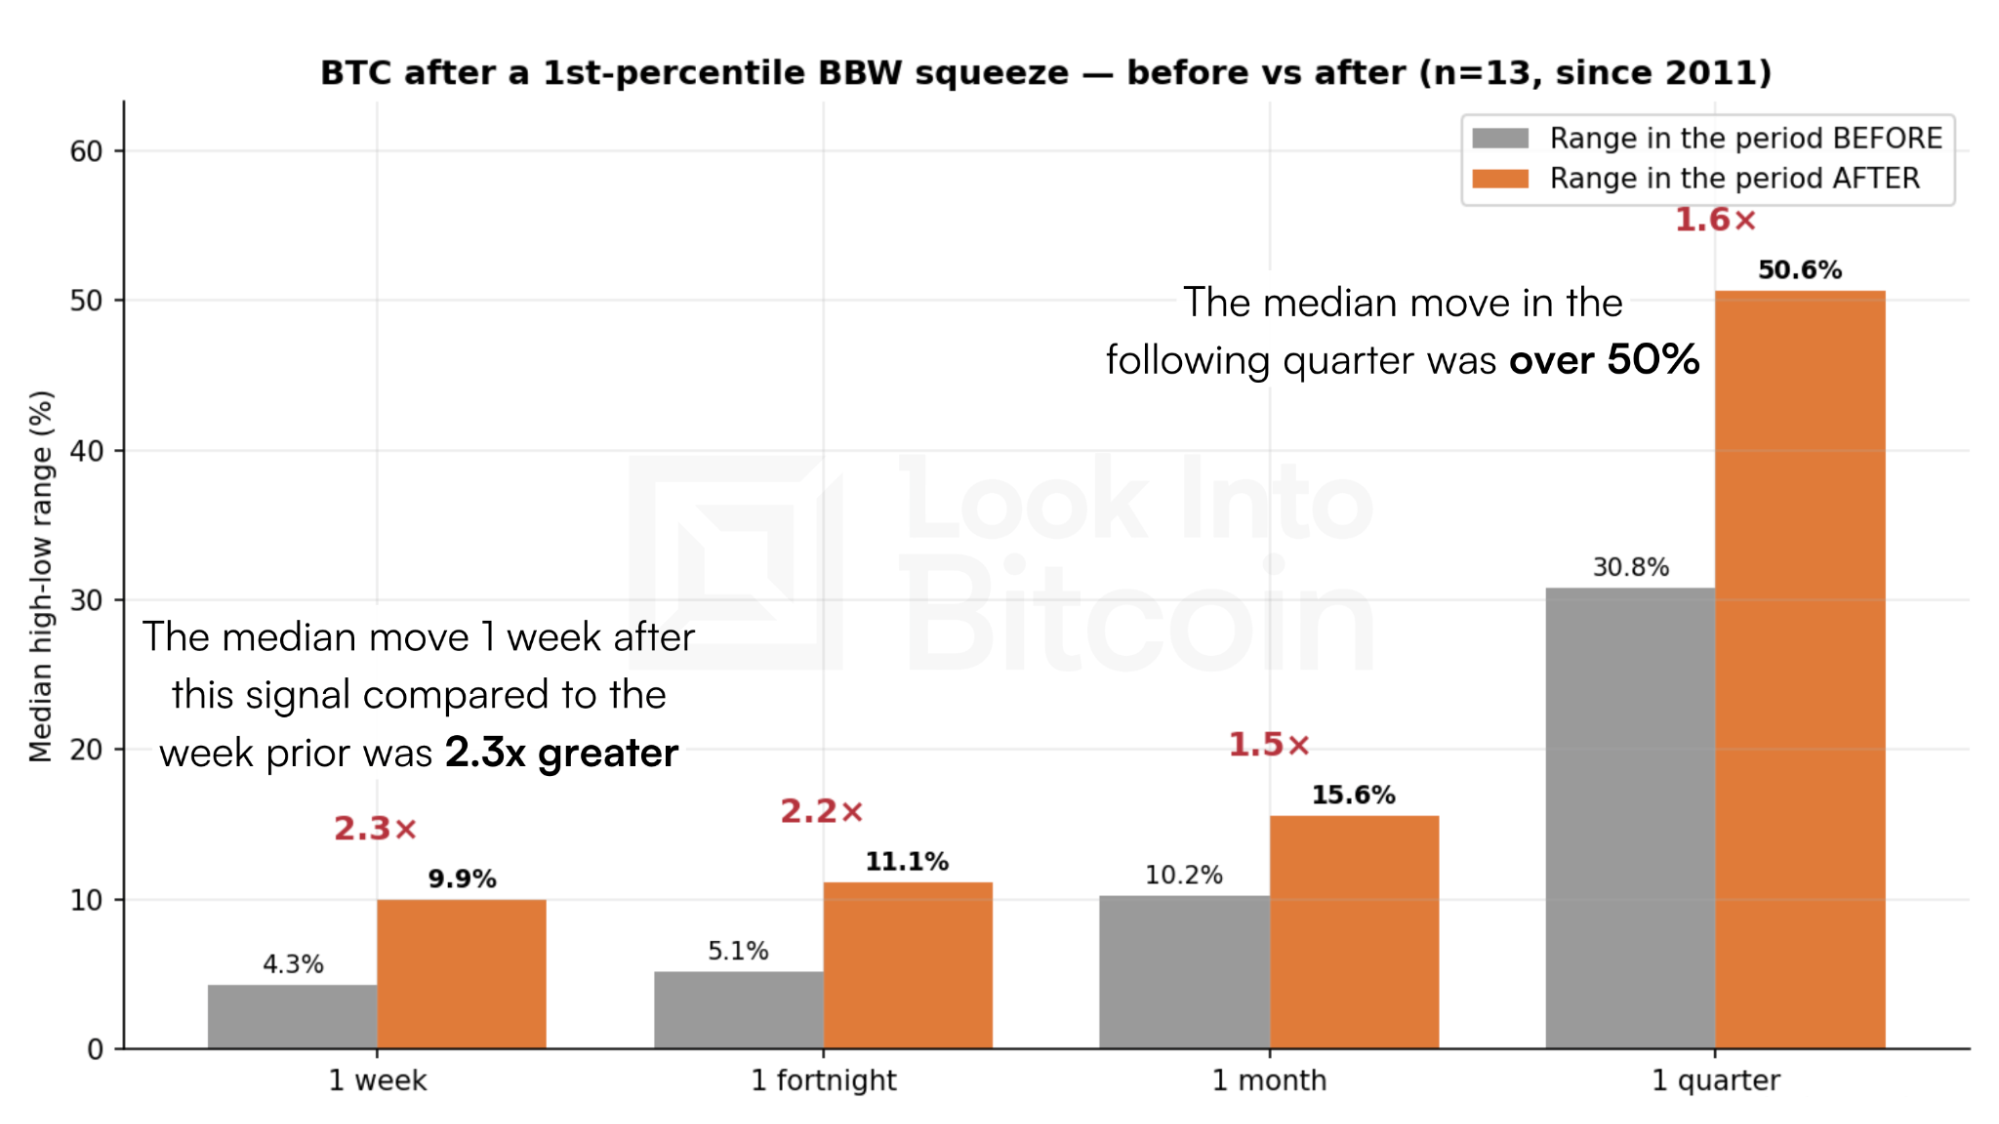
Figure 3: Median volatility before and after each squeeze, across four timeframes.
Nine of the 13 instances resolved into a genuinely volatile breakout. Medians are used deliberately here rather than averages, because Bitcoin's early history contains moves of several hundred percent that would badly distort the mean and make the figures look far more dramatic.
Price Implications
Applying those historical median expansions from current levels gives a rough sense of scale rather than a forecast. Over the coming weeks, a move of that magnitude points toward roughly $73,000 to the upside or the low $50,000s to the downside. Extending out to a full quarter, which takes us to around mid-November, the equivalent range widens considerably: approximately $95,000 above, or the low $30,000s below.
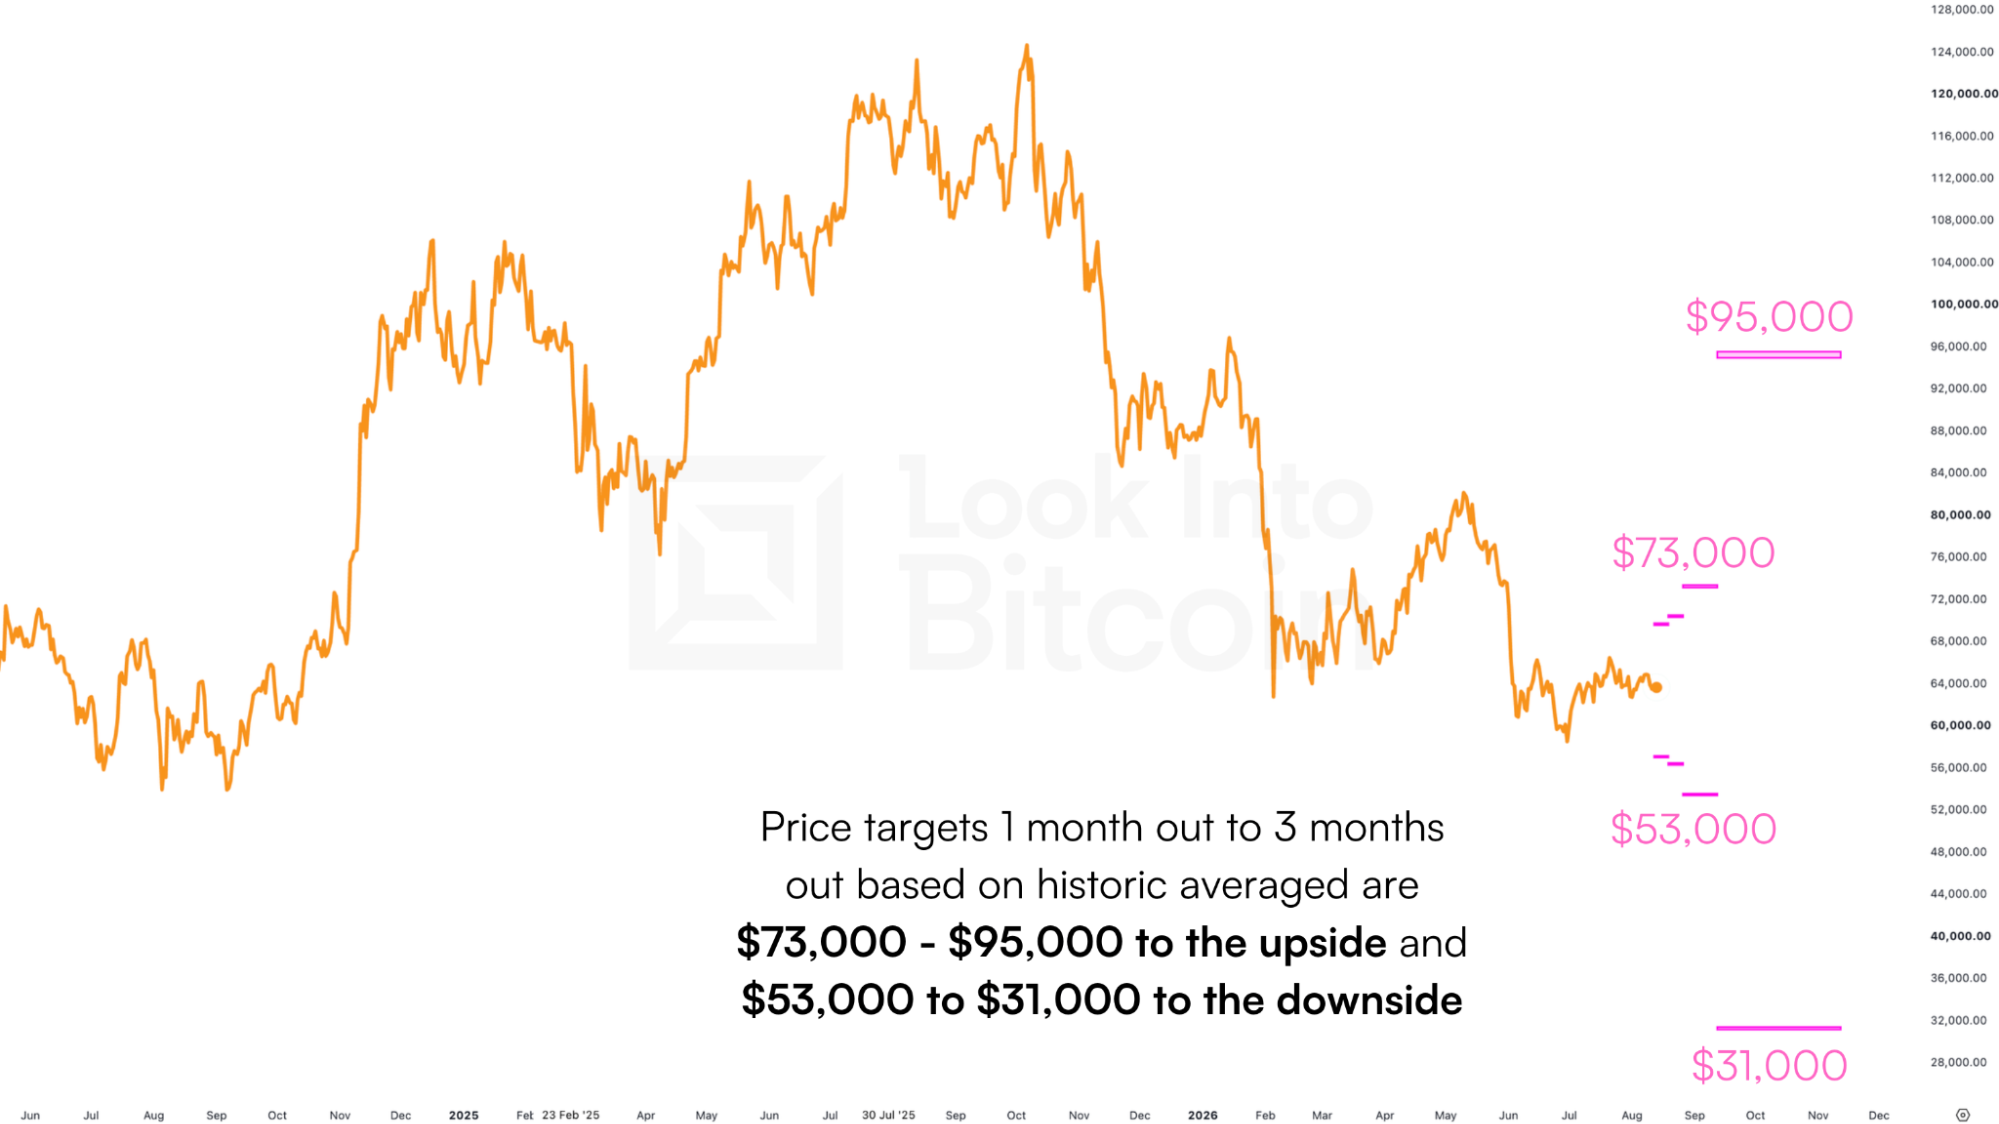
Figure 4: Historical median expansions mapped onto current Bitcoin price levels.
Which Way?
Looking at every squeeze since 2011 individually rather than as an average, the spread of outcomes tilts upward. Both one week and one month after the signal, more instances resolved higher than lower.
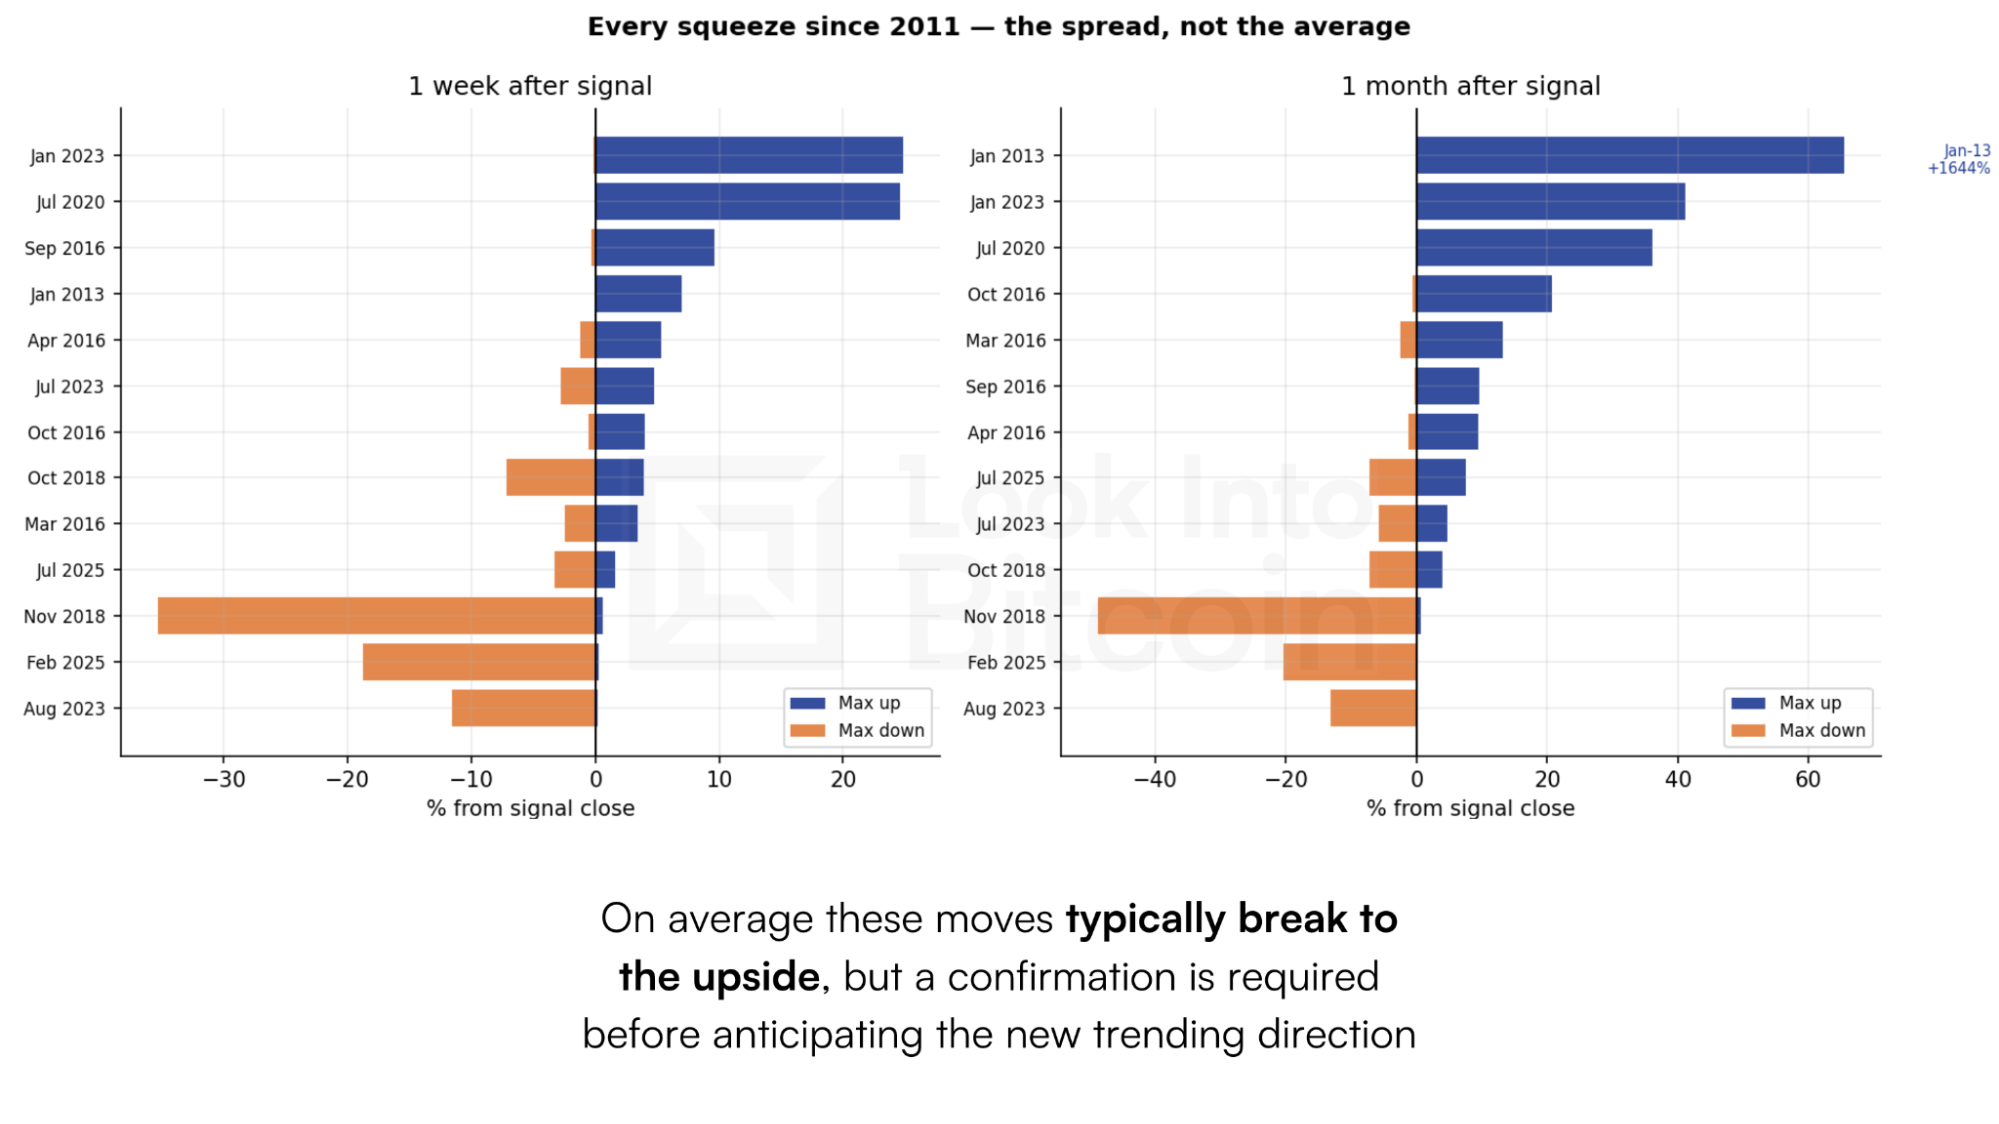
Figure 5: Individual outcomes one week and one month after each squeeze since 2011.
I am not going to speculate on direction here… regular readers will have a reasonable idea of where I sit given everything we have covered about this bottoming range in recent weeks.
We're Home!
After two years as Bitcoin Magazine Pro, we have rebranded back to Look Into Bitcoin, where all of this started over four years ago. Thanks to their team for everything over the past couple of years. We had a lot of fun, but it is good to be home and fully independent again, and we have lots of great things in the works to release in the near future!

Watch our most recent YouTube video here:
Bitcoin Is In The Bottom 1.48% - This Never Lasts Long
@MattCrosbyPro
Research Director
La información contenida en este sitio no debe considerarse asesoramiento financiero. Por favor revise la Descargo de responsabilidad para más información.