Bitcoin Hasn't Decoupled From Liquidity, We're Measuring It Wrong
21 de agosto de 2026
Author: Matt - Director of Research & Analytics
Bitcoin Magazine Pro is now Look Into Bitcoin.
Same platform, same team, same subscription: only the name and web address have changed. All old links redirect automatically. You don’t need to do anything differently.
It’s good to be home. Find us at lookintobitcoin.com.
The story doing the rounds right now is that Bitcoin has decoupled from global liquidity. Global M2 keeps printing new all-time highs while Bitcoin sits about 50% off its peak, so the correlation everyone relied on must have broken.
I think most people are simply measuring the thing wrong. This week, I’m working through why, statistically rather than anecdotally, and then showing what the correlation looks like once you measure it properly.
This week:
- Global M2 is up more than 8% over the past year while BTC is down more than 45%, and that gap is the whole basis for the decoupling claim.
- The raw four-year correlation between Bitcoin and global M2 is 68.2%, run it year-on-year with a roughly 10-week offset, and it rises noticeably.
- Gold and the S&P 500 respond to the same year-on-year method.
- Liquidity was never the only input. The dollar index has been climbing through the same period and cancelling a lot of it out.
Looks Can Be Deceiving
Take the standard Global M2 chart, overlay Bitcoin, and the past year looks like a clean breakdown in the relationship. Liquidity has expanded almost without pause, up over 8%, while Bitcoin has fallen more than 45%. If your model was "M2 goes up, Bitcoin goes up", it has failed.
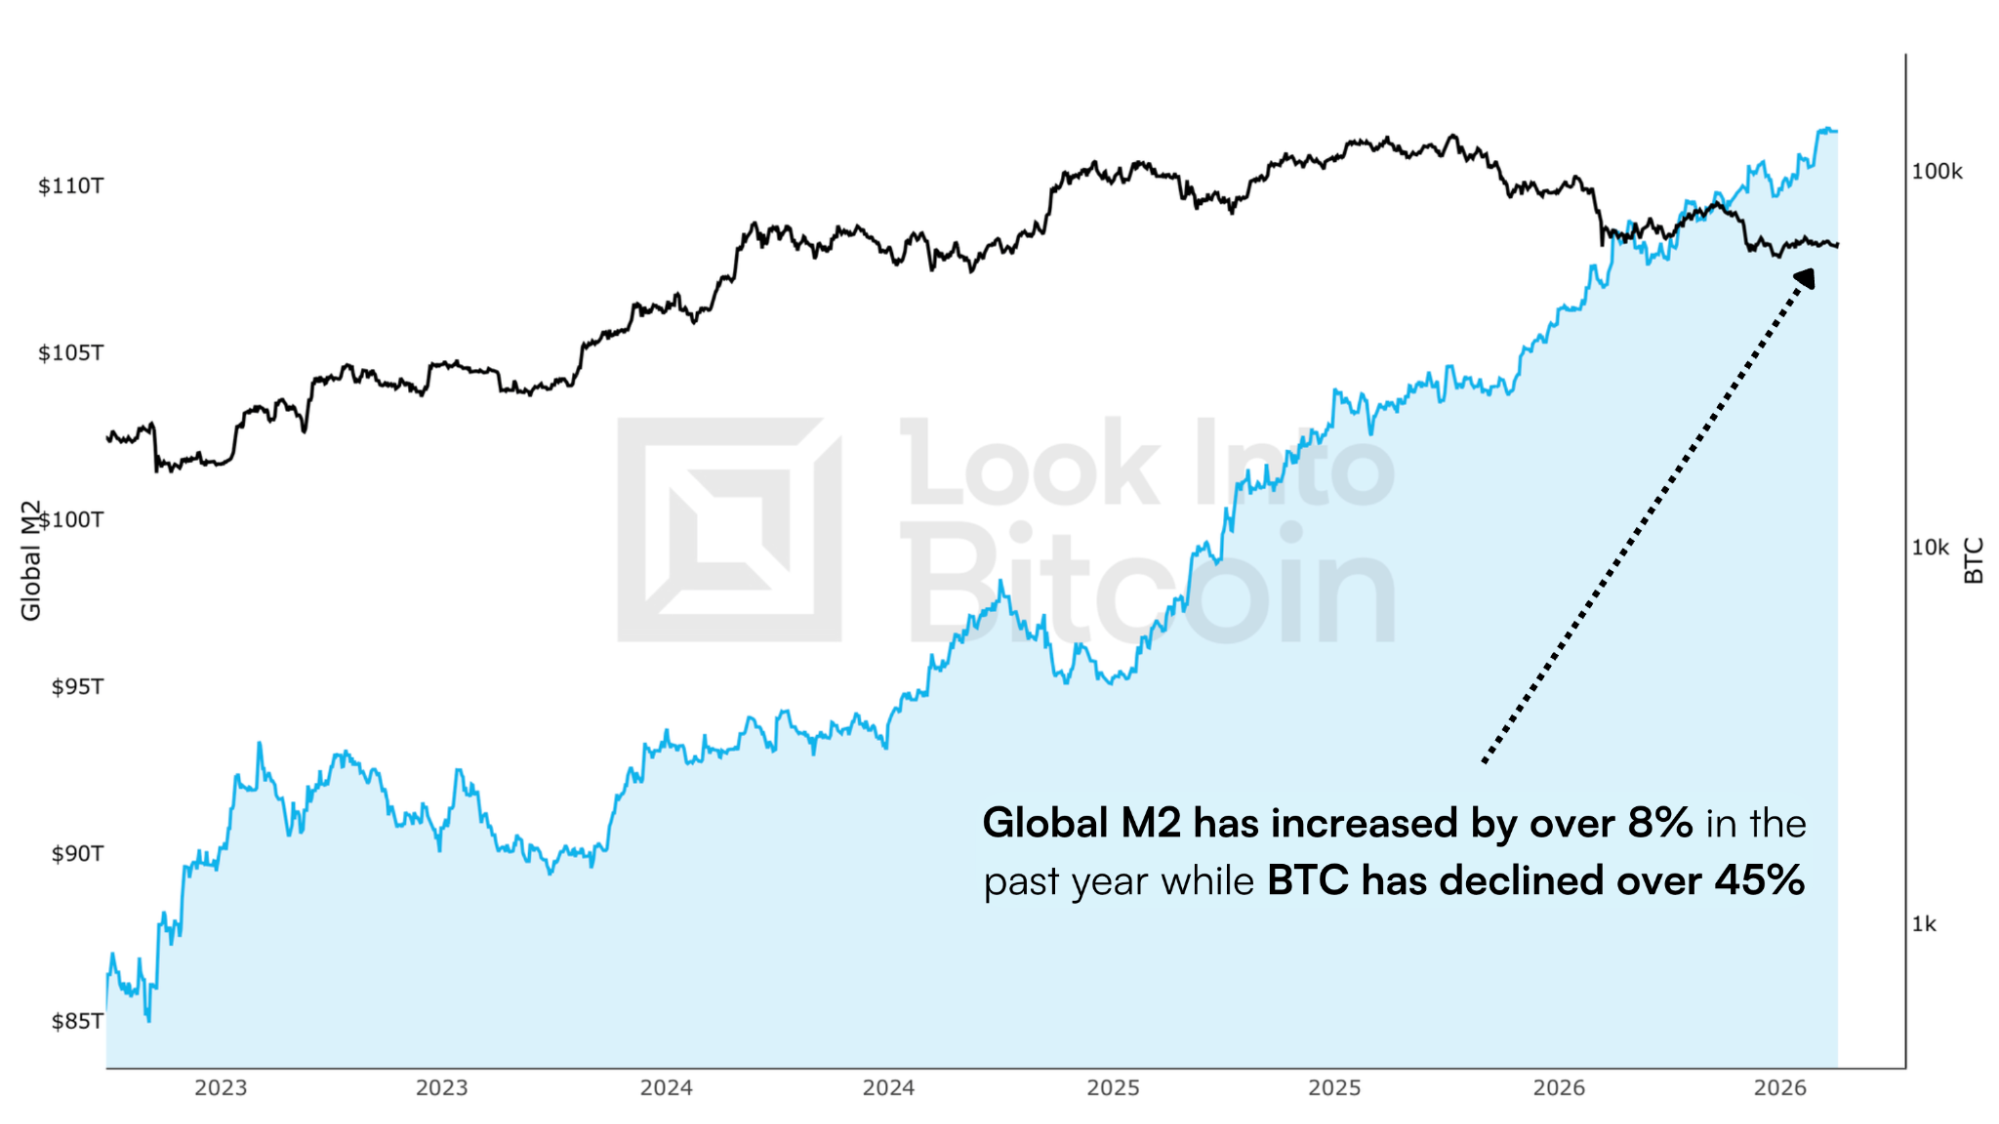
Figure 1: Global M2 has risen over 8% in the past year, while Bitcoin has fallen 45%.
The problem is that Global M2 spends most of its life trending upward, so measuring an asset against it in absolute terms tells you almost nothing. Bitcoin responds to how fast that pool of liquidity is growing or shrinking, and a chart of the level itself hides exactly that.
Measuring It Properly
Convert both to a year-on-year basis, and the picture changes. You're now comparing the rate at which liquidity is accelerating or decelerating against the rate at which Bitcoin is appreciating or declining, and the turns line up.
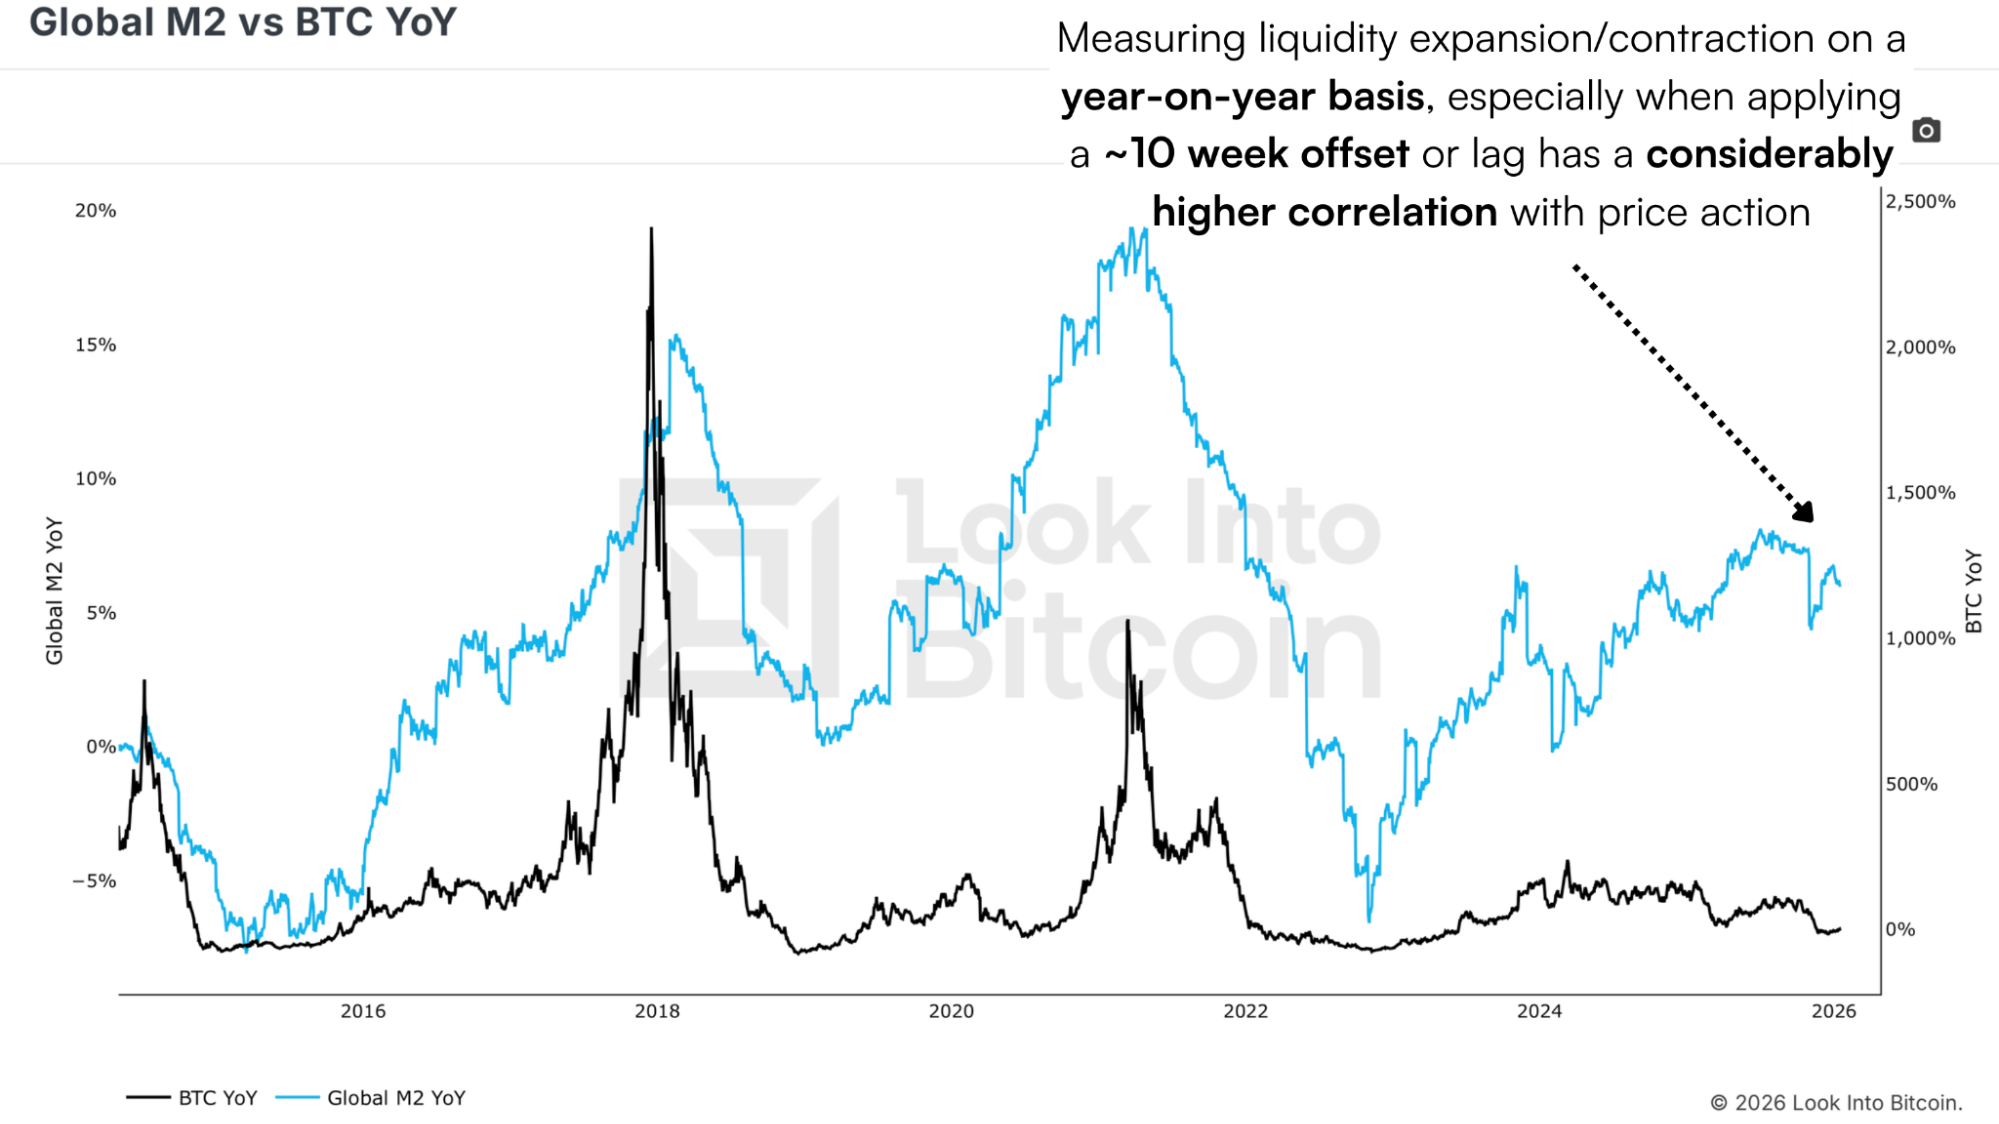
Figure 2: Global M2 YoY against BTC YoY, showing the two moving together.
The numbers say the same thing. Over the past four years the raw correlation between Bitcoin and Global M2 is 68.2% and falling. Switch to year-on-year, and it rises to 70.9%. Apply the roughly 10-week offset that liquidity historically takes to reach risk assets, and it climbs again to 73.9%.
This is true outside of Bitcoin too. Gold's annual rate of change shows a 0.5 relationship with Global M2's annual change across 38 years of data, and putting the two on a chart over the past couple of decades makes that hard to argue with. It’s a similar story for the S&P 500, looking at its yearly rate of change and YoY M2 growth, with both data sets practically mirroring each other over the past few decades.
Forgotten Factor
The decoupling argument leaves something out. Liquidity was never the only macro force acting on Bitcoin, and for most of the past year a second one has been pulling hard in the other direction.
The US Dollar Index climbed through the same stretch that M2 expanded. Bitcoin and the dollar move against each other, so a strong dollar pulls money out of risk assets no matter how much liquidity is sloshing around. That gives you two inputs working against one another, and until recently the dollar was the stronger of the two.
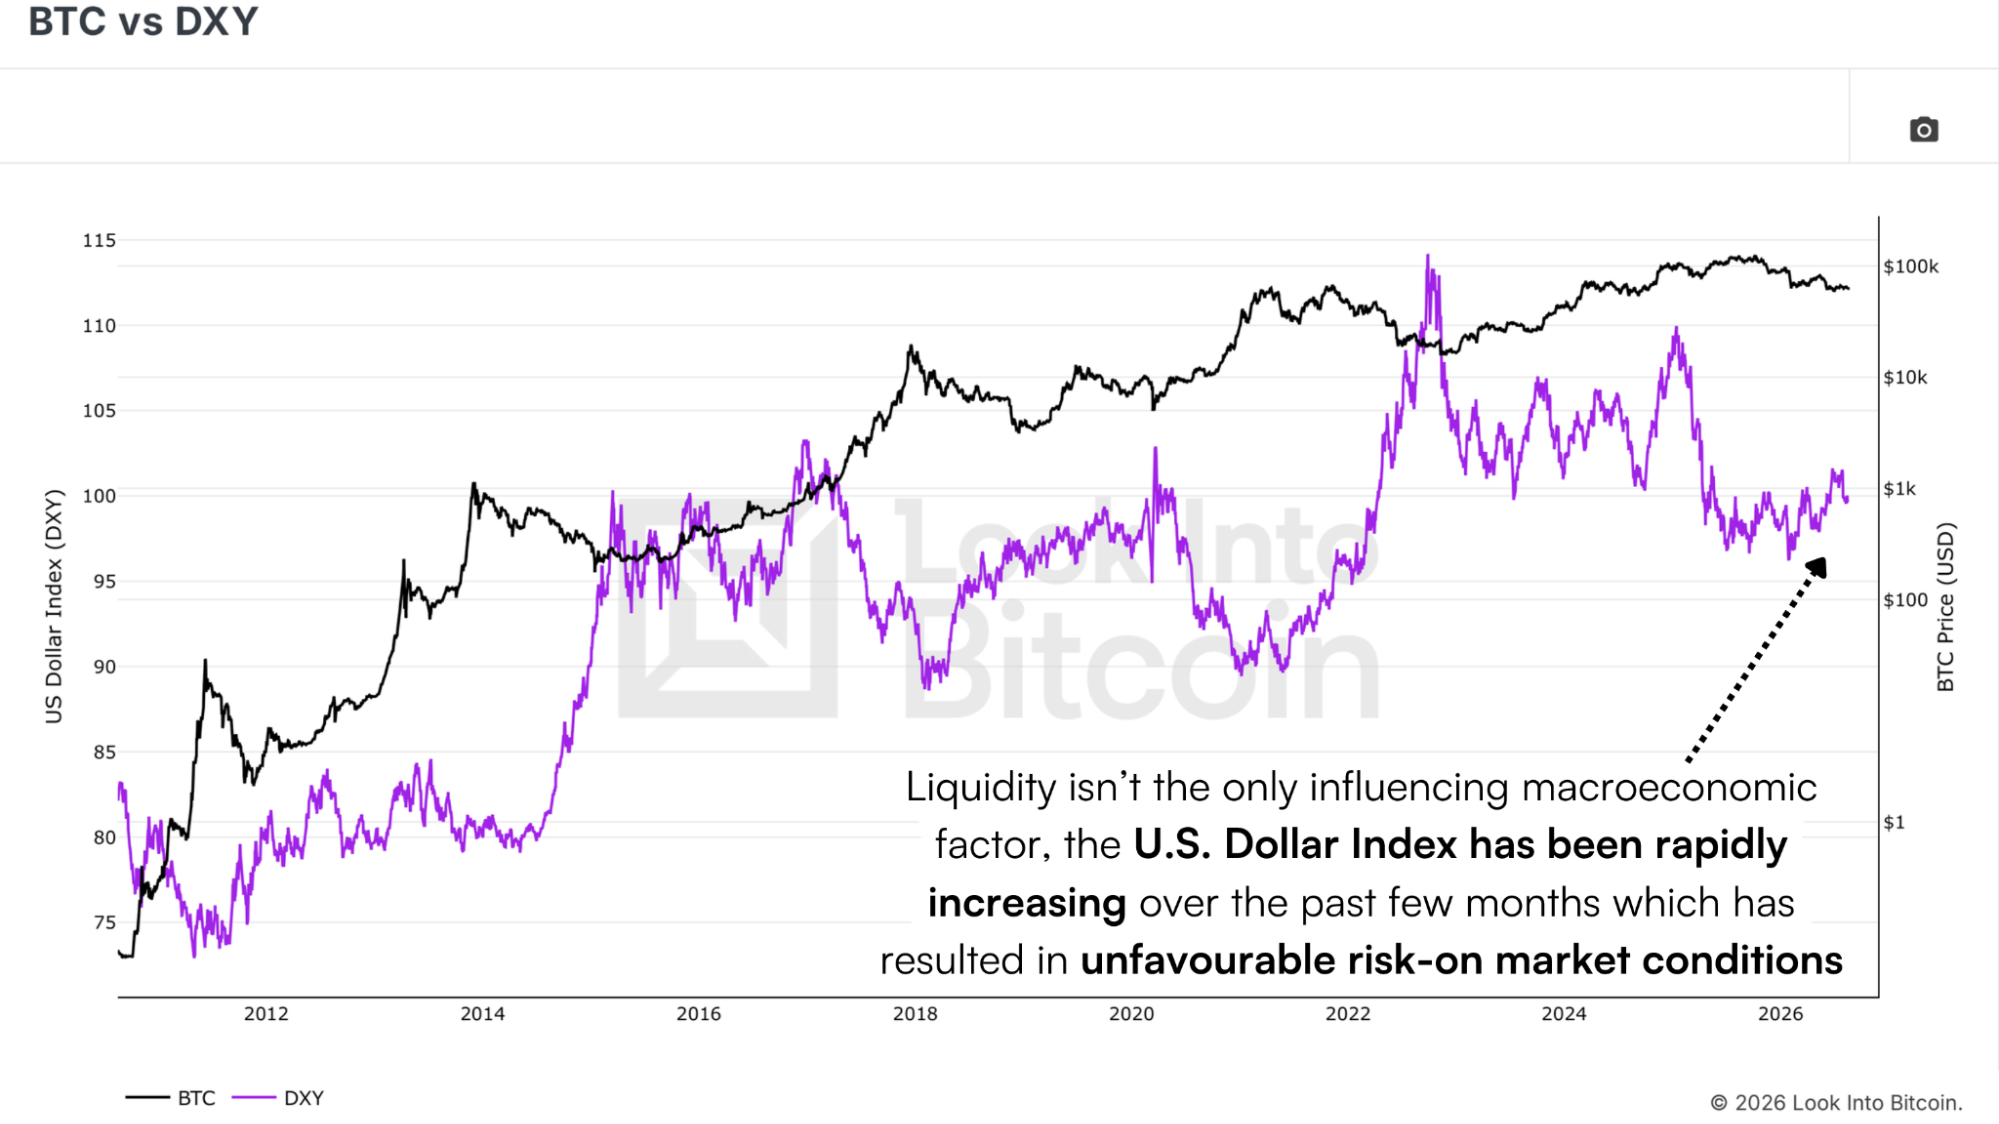
Figure 3: Bitcoin and the US Dollar Index tend to move inversely.
The dollar responds to the same treatment. Take the dollar index year-on-year, invert it because the relationship is negative, apply the same 70-day offset, and the correlation comes out around 0.59. Drop the offset and it weakens; drop the year-on-year basis as well, and it weakens further. That the same 10-week transmission lag shows up in two separate datasets is harder to explain as coincidence than as a mechanism.
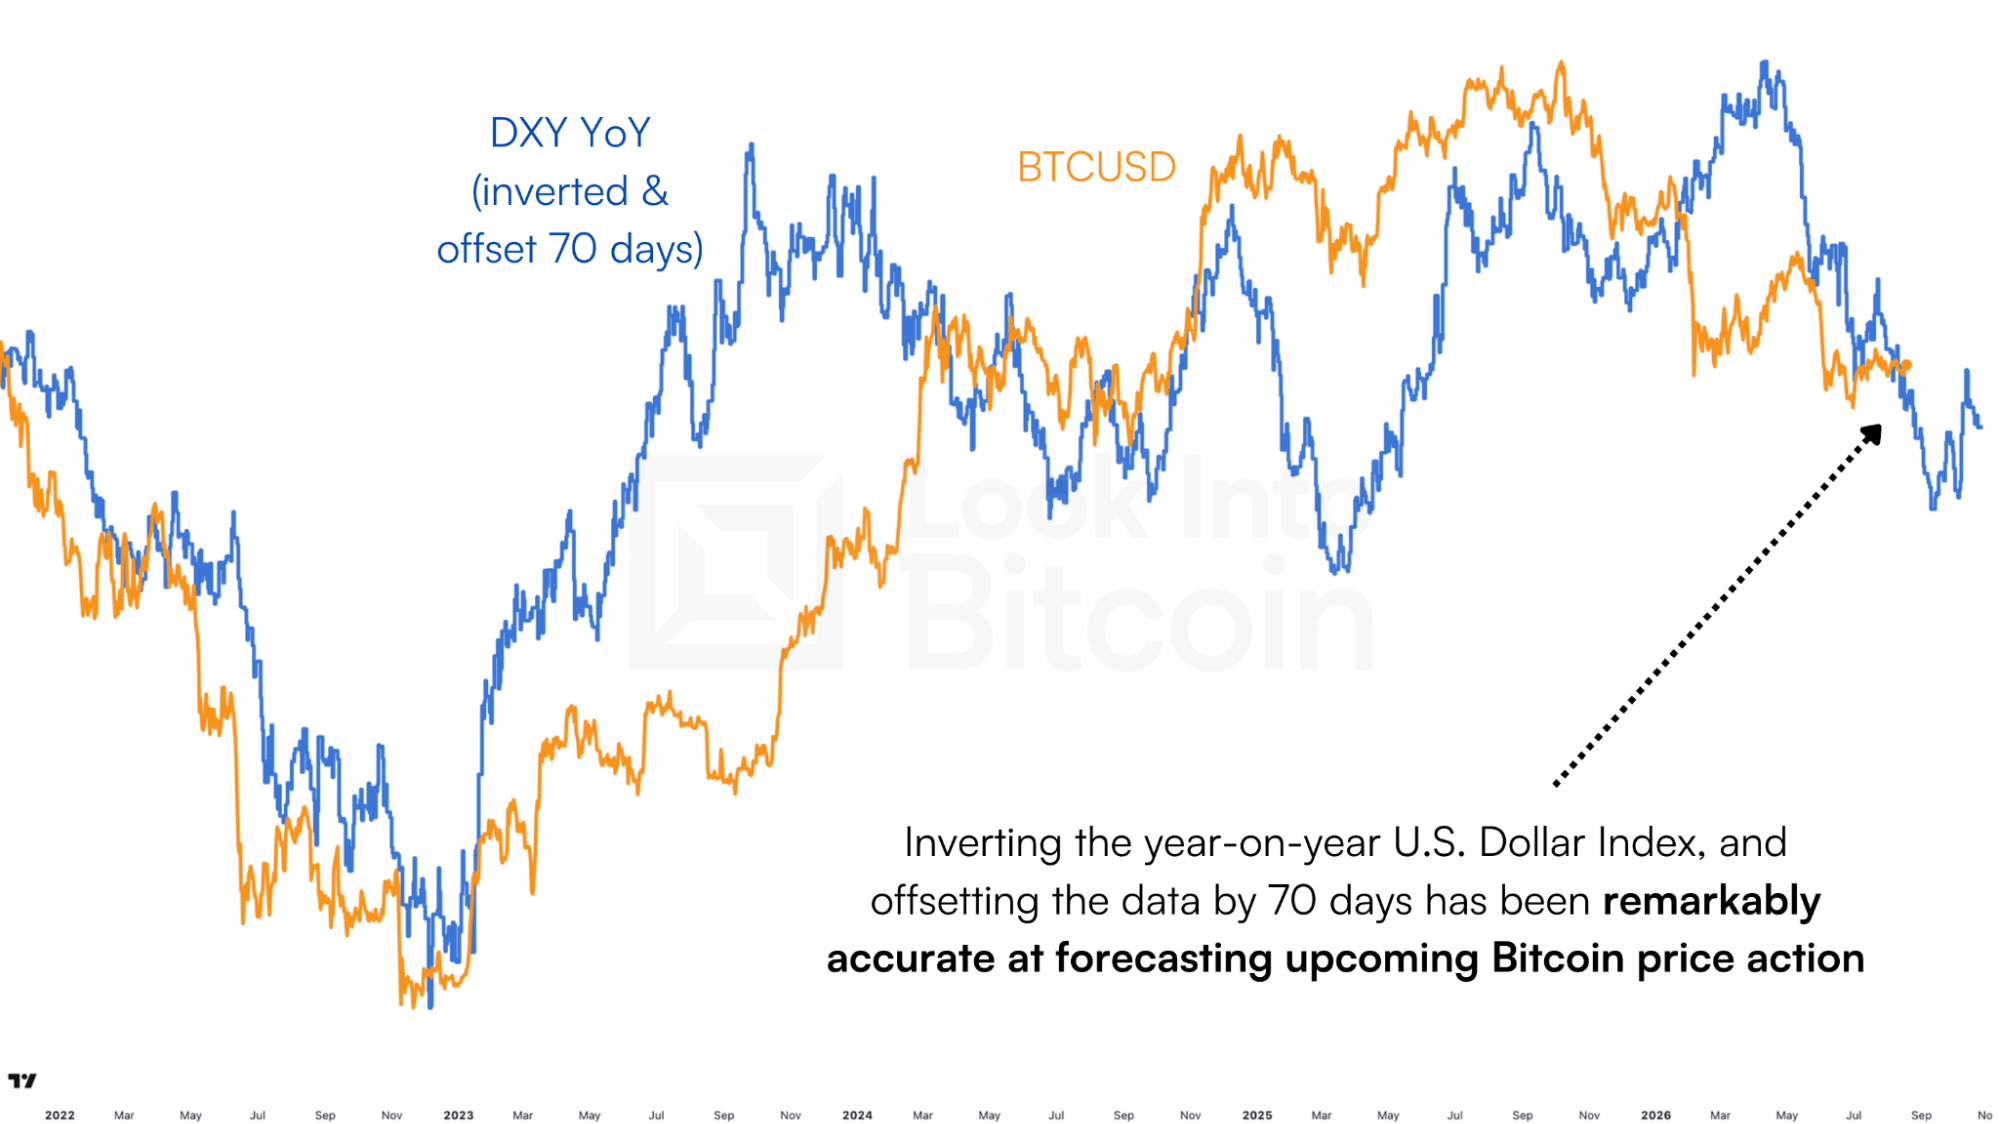
Figure 4: BTCUSD against the inverted year-on-year US Dollar Index.
What's Turning
Both the dollar and the liquidity models point toward continued pressure into around the middle of September before conditions improve. M2 spent a long stretch flatlining roughly a year ago, so the year-on-year data would have a reasonable runway of upside beyond that point.
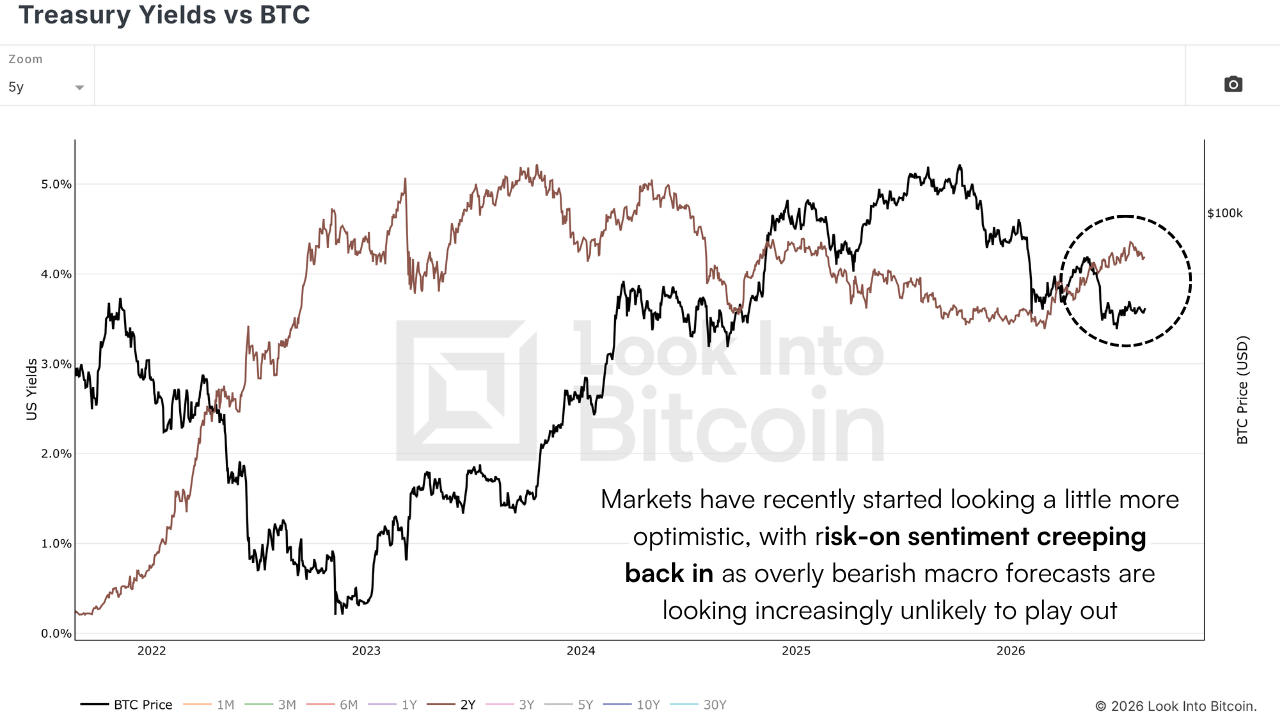
Figure 5: The 2-year Treasury yield has started to turn over as Bitcoin holds.
I'd rather react than predict, so watching the inputs is more useful. The 2-year Treasury yield is one of the more reliable ones. When it declines, it usually points to more risk-on conditions ahead, and after rallying hard through the period, Bitcoin struggled, it has started to turn over. Rate cut expectations priced in for the rest of the year aren't especially hawkish. Manufacturing PMI recently crossed above 50 for the first time in years and has held there.
Where That Leaves Us
No single line tells you where Bitcoin goes next. Global M2 with an offset isn't a crystal ball, and anyone presenting one indicator as the complete picture is selling something. Measured as a rate of change, the liquidity relationship is still there. The same framework works on gold and on equities, which is why I trust it. And the dollar accounts for most of the divergence people have been calling a decoupling.
Also, I'll be at Bitcoin Asia in Hong Kong next week with two sessions on the agenda. If you're in town, DM me on X @MattCrosbyPro and come say hello. And if you need a ticket, let me know and I'll see what I can do. Thanks for reading, and I'll see you in the next one!
Watch our most recent YouTube video here:
Everyone Is Measuring Global M2 Wrong
@MattCrosbyPro
Research Director
La información contenida en este sitio no debe considerarse asesoramiento financiero. Por favor revise la Descargo de responsabilidad para más información.