Onchain Market Indicators
Price Forecast Tools
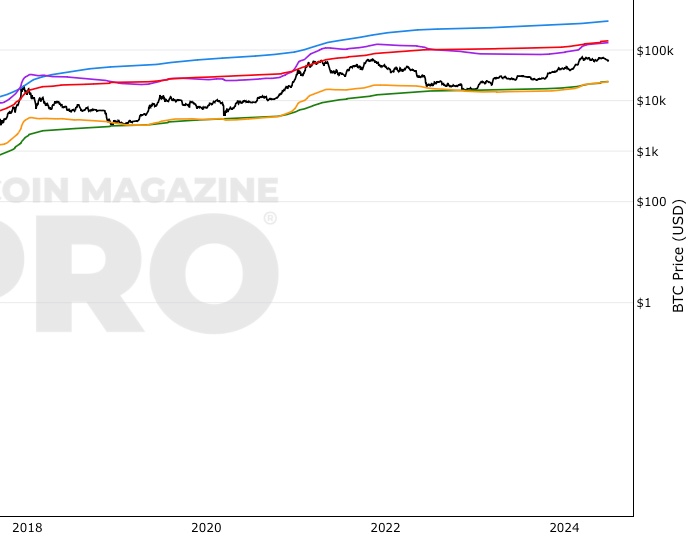
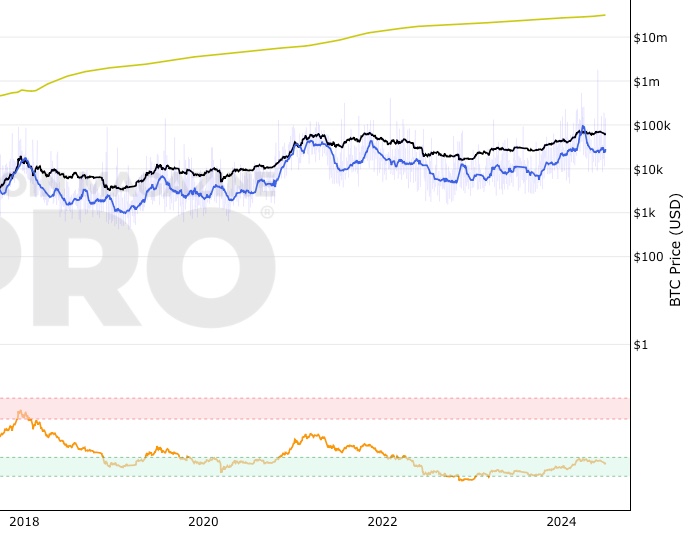
Top Cap, Terminal Price, Delta Top, CVDD, Balanced Price
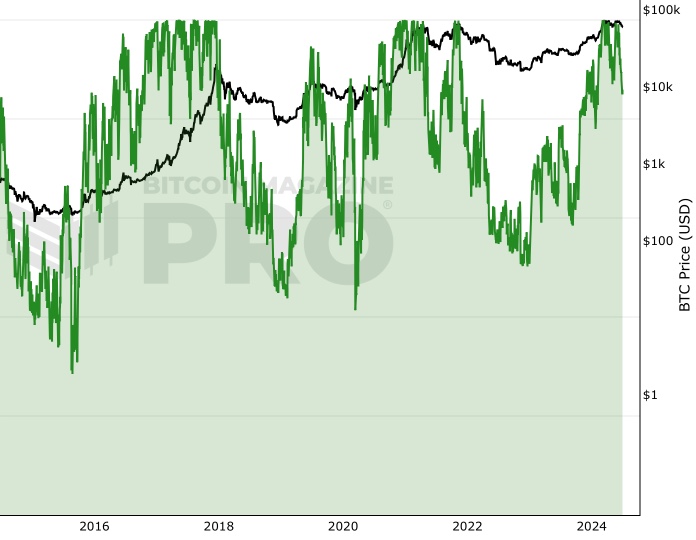
MVRV Z-Score
Pulls apart differences between Market Value and Realised Value to identify market cycle highs and lows.
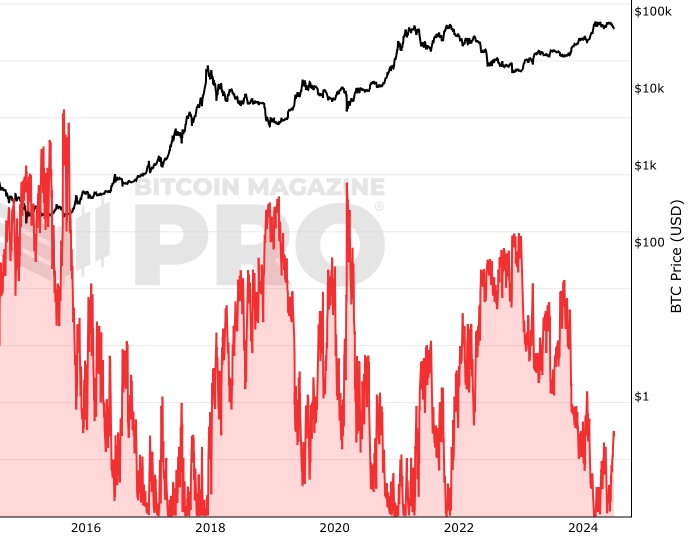
RHODL Ratio
On Chain Indicator using Realized HODL Ratio’s to identify cycle high price tops.
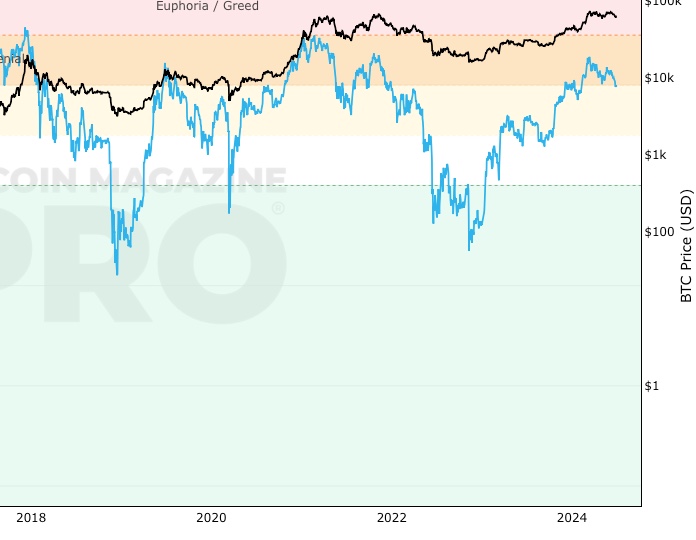
Net Unrealized Profit/Loss (NUPL)
On-chain indicator for investor sentiment market stages
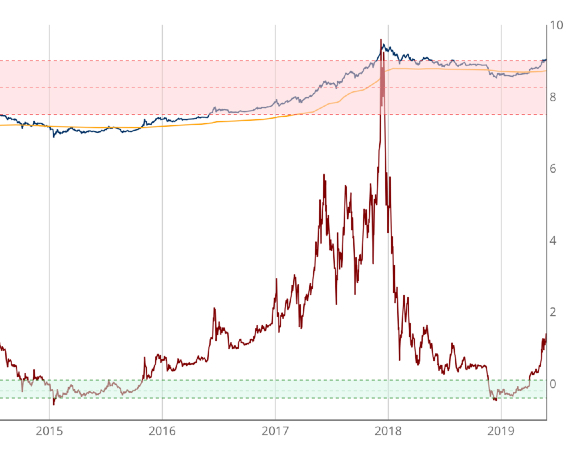
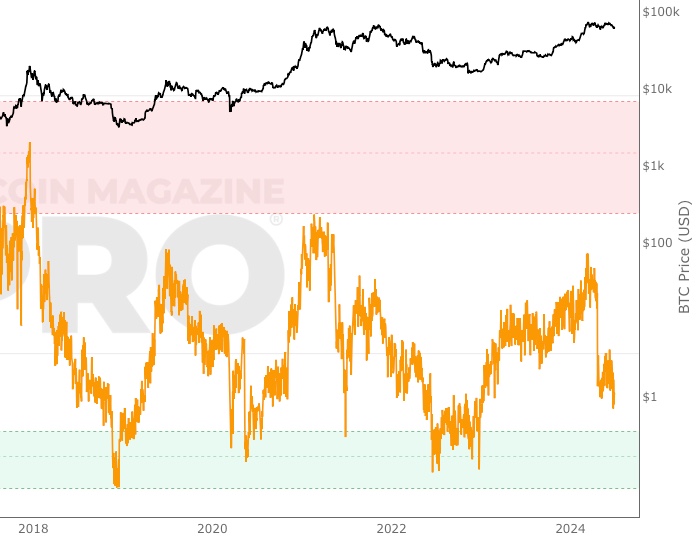
Reserve Risk
Long term Bitcoin investor confidence relative to Bitcoin price.
AASI (Active Address Sentiment Indicator)
Comparing change in price with change in number of addresses to determine if Bitcoin is over/undervalued in the short term.
Advanced NVT Signal
This adaptation of NVT Signal adds standard deviation bands to identify when Bitcoin is overbought or oversold.
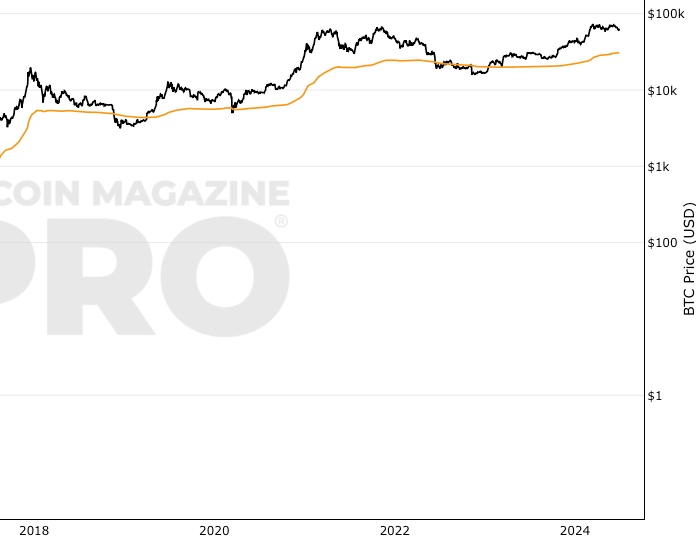
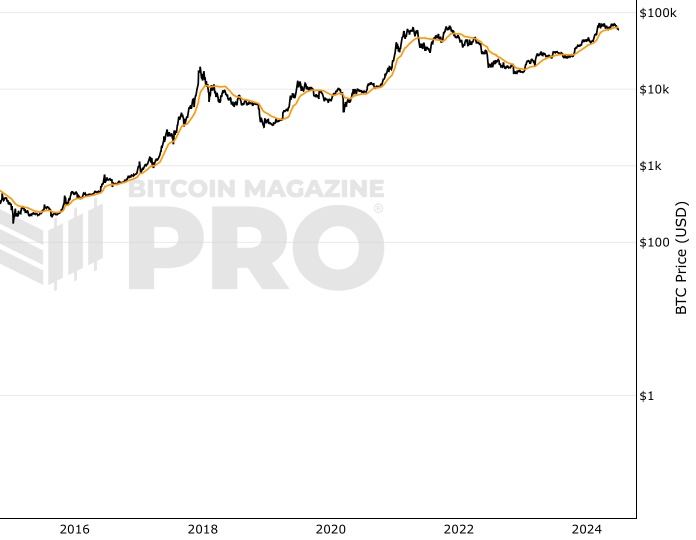
Realized Price
The aggregate cost-basis of all bitcoin.
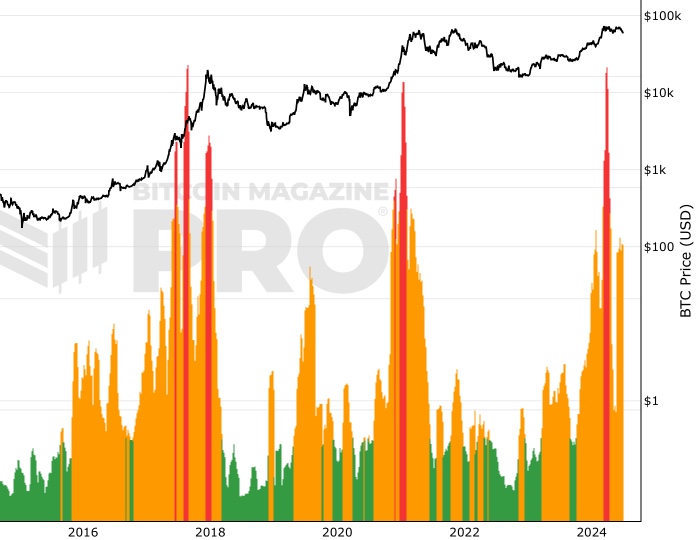
Value Days Destroyed (VDD) Multiple
Identifies Bitcoin cycle highs by comparing near-term spending velocity with yearly average of spending velocity.
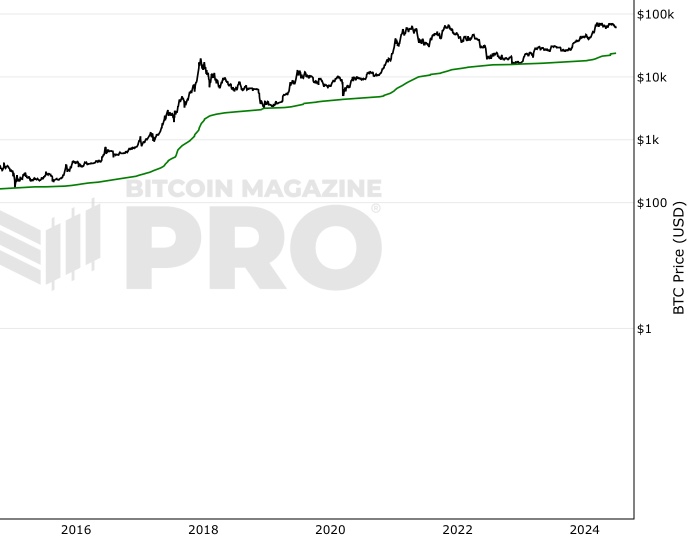
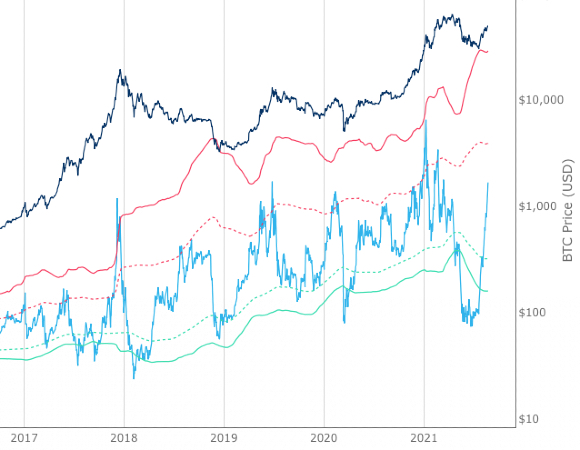
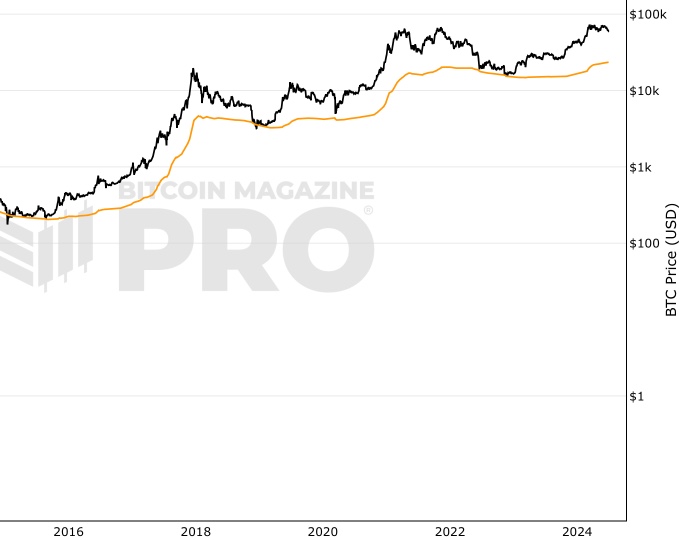
CVDD
Pricing model for identifying Bitcoin bear market lows.
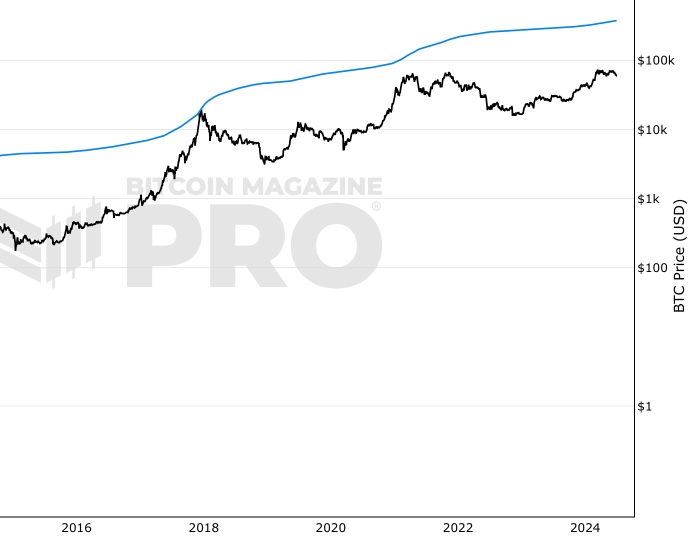
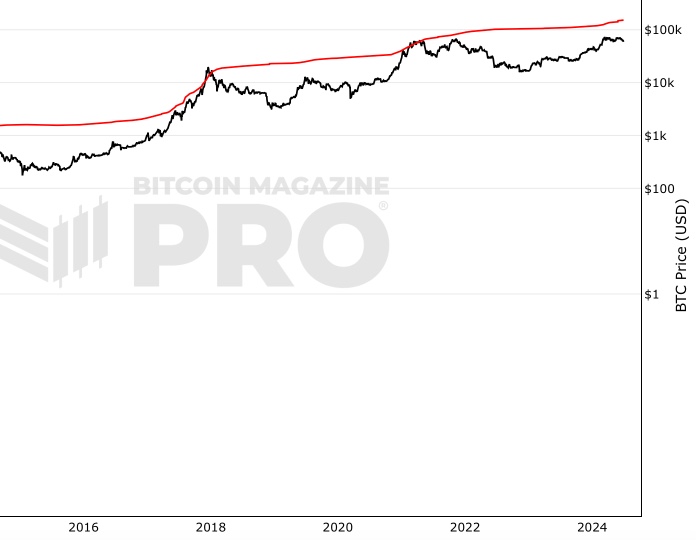
Top Cap
Pricing model for identifying Bitcoin bull market highs.
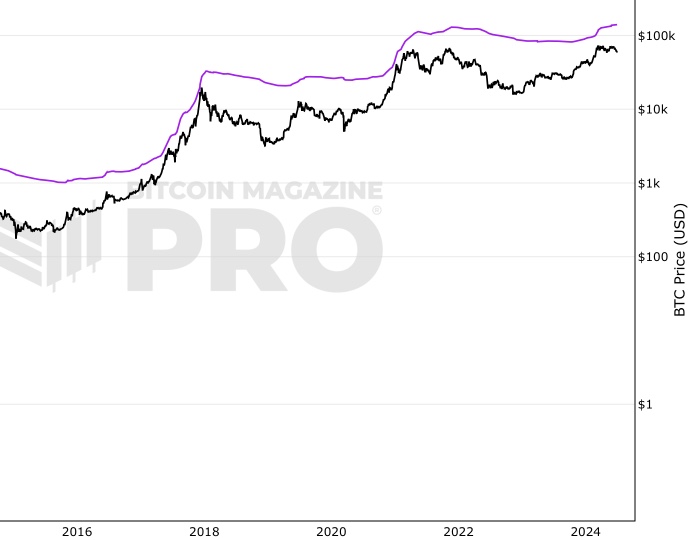
Delta Top
Pricing model for identifying Bitcoin bull market highs.
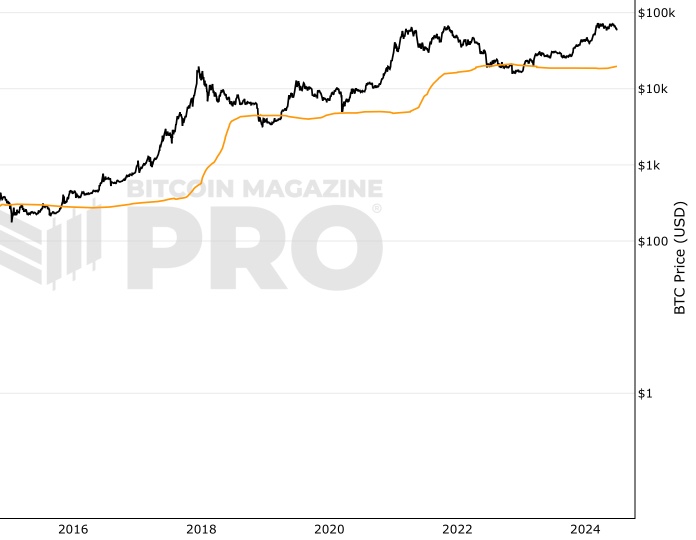
Balanced Price
Pricing model for identifying Bitcoin bear market lows.
Terminal Price
Pricing model for identifying Bitcoin bull market highs.
Long-Term Holder Realized PriceNew
Average price at which long-term investors have purchased their Bitcoin.
Short-Term Holder Realized PriceNew
Average price at which short-term investors have purchased their Bitcoin.
Percent Addresses in ProfitNew
The Percentage of Bitcoin Addresses in Profit.
Percent Addresses in LossNew
The Percentage of Bitcoin Addresses in Loss
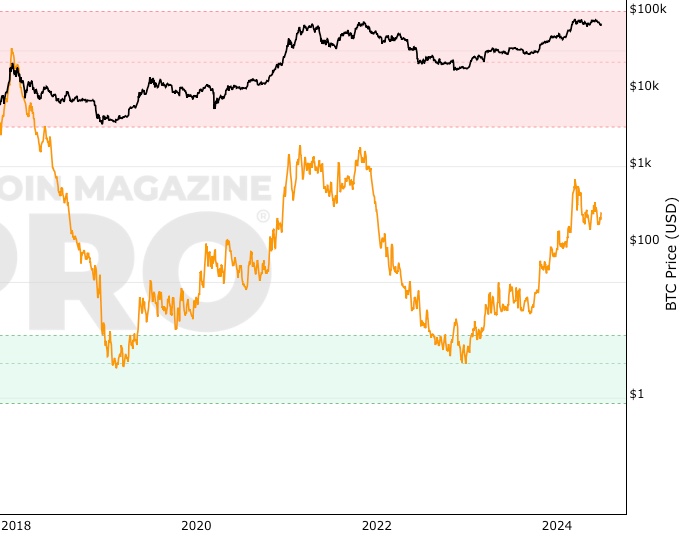
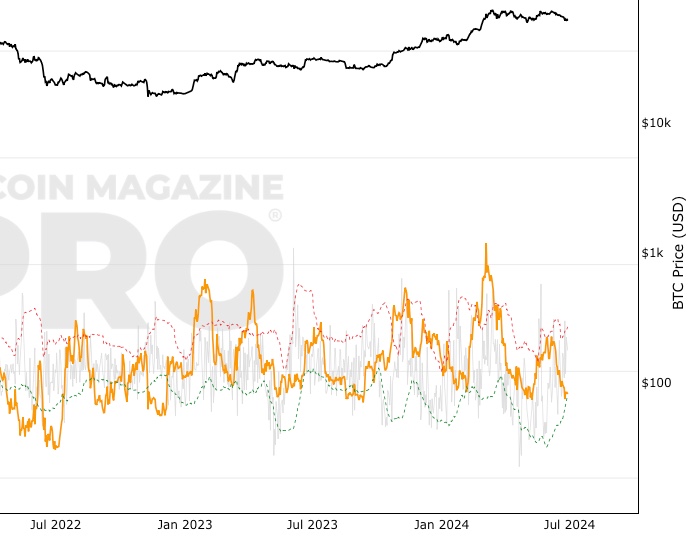
Puell Multiple
Relationship between daily bitcoin issuance and price.
Please note, the indicators above are experimental. There is no guarantee certain rules within each model will continue to apply as Bitcoin progresses along its adoption journey. Any information on this site is not to be considered financial advice. Please review the Disclaimer section for more information.