
 Bitcoin: Stock-to-Flow Model
Zoom in with touchscreen: Touch and hold with ONE finger then drag.
Zoom in on desktop: Left click and drag.
Reset: Double click.
What Is Stock To Flow (S2F)?
Stock to flow is a forecasting tool for Bitcoin price.
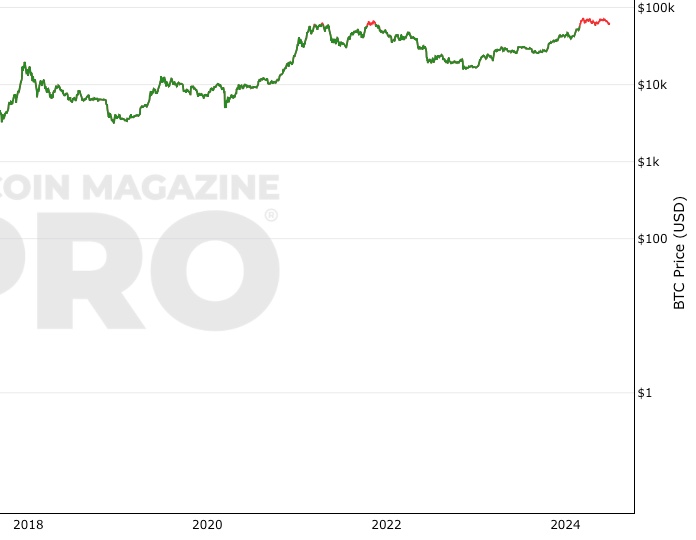
It creates a line on the chart above that shows an estimated price level based on the number of bitcoins available in the market relative to the amount being produced (mined) each year.
The score on the stock to flow line is the forecasted price for bitcoin at that particular time. By hovering your cursor over the line on the chart, you can see the forecasted price. To date, it has broadly forecasted price correctly as $BTC price has followed the stock to flow line.
As the amount of bitcoins to be mined reduces over time, the stock to flow number (s2f ratio) increases, as supply coming onto the market is reducing. That is why this model is forecasting that the price of Bitcoin will increase in the future.
Can You Explain That In More Detail?
The stock-to-flow model treats Bitcoin as being comparable to commodities and precious metals such as gold, silver, or platinum. These are known as 'store of value' commodities because they retain value over long time frames due to their relative scarcity.
It is difficult to significantly increase their supply. For example, the process of searching for gold and then mining it is expensive and requires time and resources.
Bitcoin is similar because it is also scarce. In fact, it is the first-ever scarce digital object to exist! There are a limited number of coins in existence and it will take a lot of electricity and computing effort to mine the 2 million outstanding coins still to be mined. Therefore the supply rate is consistently low.
Why Is Stock-To-Flow (S2F) Useful For Bitcoin Investors And Traders?
It is useful because it can be used as a forecasting tool to identify where the price of Bitcoin may go in the future. There are many other indicators that also forecast the price of Bitcoin, this particular tool focuses on the supply schedule of Bitcoin.
How To View The Chart
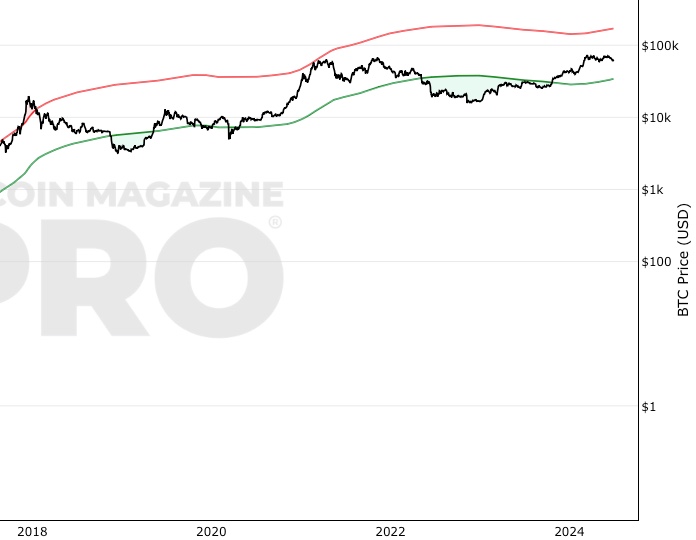
On the above bitcoin chart, price is overlaid on top of the stock-to-flow ratio line. We can see that price has continued to follow the stock-to-flow of Bitcoin over time. The theory, therefore, suggests that we can project where price may go by observing the projected stock-to-flow line, which can be calculated as we know the approximate mining schedule of future Bitcoin mining.
The colored dots on the price line of this chart show the number of days until the next Bitcoin halving (sometimes called 'halvening') event. This is an event where the reward for mining new blocks is halved, meaning miners receive 50% fewer bitcoins for verifying transactions.
Bitcoin halvings are scheduled to occur every 210,000 blocks – roughly every four years – until the maximum supply of 21 million bitcoins has been generated by the network. That makes the stock-to-flow ratio (scarcity) higher so in theory price should go up. This has held true previously in Bitcoin's history.
The stock-to-flow line on this chart incorporates a 365-day average into the model to smooth out the changes caused in the market by the halving events.
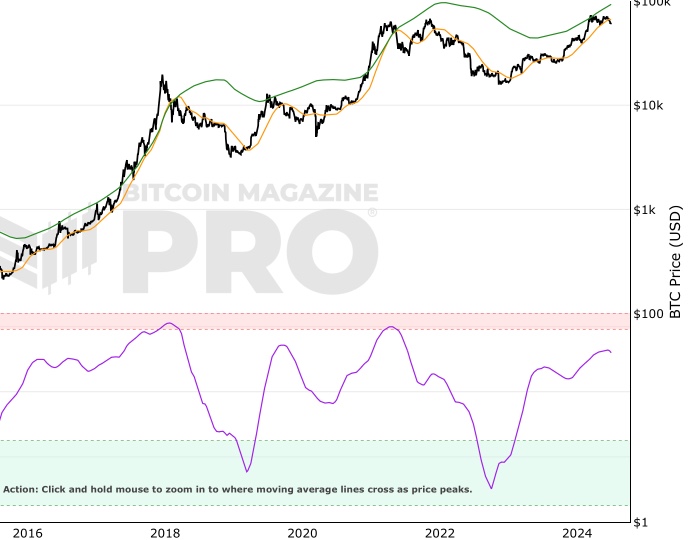
In addition to the main stock-to-flow chart, we created an additional tool for you to use which is free. It is located at the lower section of the chart and is a divergence chart tool. It shows the difference between price and stock-to-flow.
When price moves above the stock-to-flow level, the divergence line turns from green to red. When price moves below the stock-to-flow line the divergence tool turns from red to green. Because of this, it allows us to easily see how price interacts with stock-to-flow through market cycles over time. This divergence line is also sometimes referred to as ‘Stock-to-flow Deflection Bitcoin’.
Data Source Inputs For Generating The Chart
The key data source for the stock-to-flow Bitcoin chart is the supply schedule for Bitcoin. This is the number of bitcoins that have been mined to date and will be mined in the future. Because the supply schedule of Bitcoin is built into the Bitcoin code, we know exactly what the supply schedule will be in the future.
We can see that the supply schedule decreases overtime on this chart taken from a wikipedia article that explores the number of bitcoins over time:
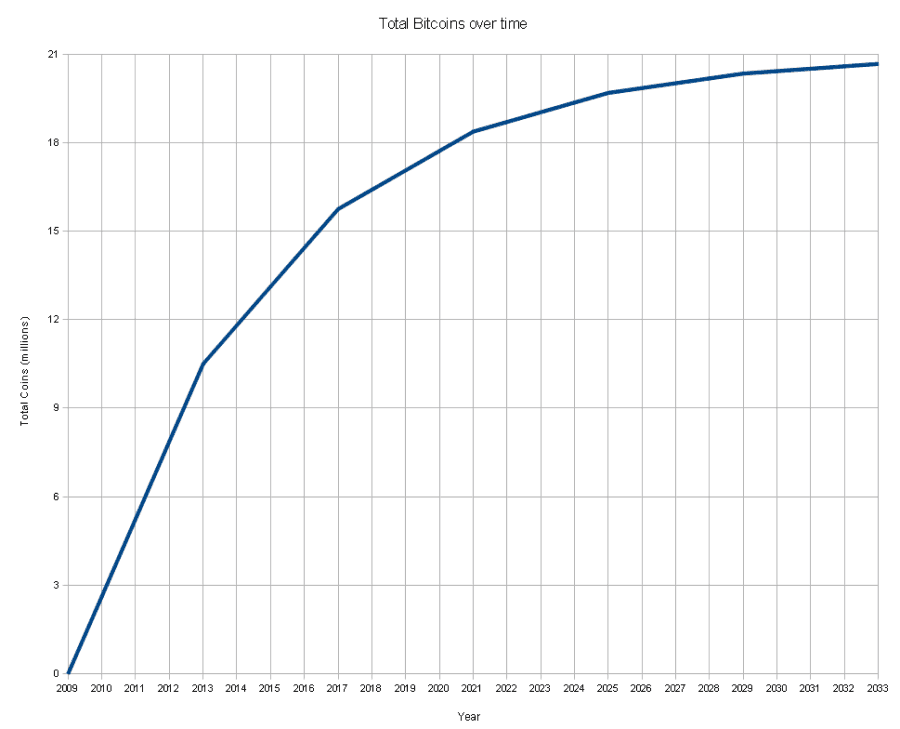
The Bitcoin stock to flow indicator then uses regression analysis to create the stock to flow values shown on the Stock to flow chart.
Bitcoin Price Prediction Using This Tool
The Stock to flow chart is used by many people to try and predict the future price of Bitcoin. The stock-to-flow line is an estimated future price point for $BTC.
The Stock-to-flow chart predicts that the price of Bitcoin on 31st December 2022 will be $78,280. Its Bitcoin price prediction for 1 year later on the 31st December 2023 is $81,956. There is then a significant jump the following year with a Bitcoin price prediction price of $306,984 on 31st December 2024.
The stock-to-flow model focuses only on supply-side analysis to provide these Bitcoin price forecasts.
Created By
Plan B is an anonymous individual who typically communicates via his Twitter page. His name is taken from the fact that Bitcoin is sometimes referred to as Plan B, because it offers an alternative to the current monetary system. Many Bitcoiners believe one day that Bitcoin will become the global reserve currency. So we will move from the current monetary system which is government-controlled and managed by central banks (Plan A) to a Bitcoin-backed system (Plan B).
For this to happen, we would need to see hyperbitcoinization. The process of mass adoption not just from retail participants, but also from major institutions like sovereign wealth funds, pension funds and governments.
Date Created
January 2019
Fall Further Down The Rabbit Hole
Medium article: Modelling Bitcoin's Value With ScarcityNote: Thank you to Harold Christopher Burger who helped refine this live chart.
Since the original article, Plan B has also discussed how the stock to flow (S2F) model compares to classic risk and return models in his article Efficient Market Hypothesis and Bitcoin Stock-to-Flow Model.
Similar Live Charts That You May Find Useful
Another live chart that looks to set out future price prediction levels is the Bitcoin Rainbow live chart. It uses previous price history analysis to project a Bitcoin price forecast.
Video Explainer
You May Also Be Interested In
Bitcoin Profitable Days
The proportion of days in Bitcoin's traded history that it has been profitable to hold Bitcoin
Bitcoin Investor Tool: 2-Year MA Multiplier
Long timeframe investor tool to identify under/oversold price periods
Pi Cycle Top & Bottom Indicator
Pi Cycle Top and Bottom Indicator.
Make smarter decisions about Bitcoin. Instantly.
Access the Bitcoin and Global Macro Charts that really drive Bitcoin’s price.
+40 chart alerts. Never miss critical levels on charts again.
Analysis newsletter. Manage your emotions at market extremes.
Private Tradingview indicators. See Bitcoin chart levels in real time!
Cancel anytime.
Any information on this site is not to be considered as financial advice. Please review the Disclaimer section for more information.