
 Bitcoin: Price Forecast Tools
Zoom in with touchscreen: Touch and hold with ONE finger then drag.
Zoom in on desktop: Left click and drag.
Reset: Double click.
Bitcoin Price Predictions
Do you want to know what the price of Bitcoin will be in the future? Predicting digital currency prices with real accuracy is extremely difficult and people quoted in the media often miss the mark by a long way. Jon Mcaffee famously expected the price of Bitcoin to reach $500,000 by 2020, which never happened.
On this page we not only share industry expert price predictions, but we also provide you with a free price forecasting tool. So you can decide for yourself how high or how low the price of Bitcoin may go in the future, using actual blockchain data.
Before we explain the $BTC price forecasting tool above, here are some standout btc price predictions for how high Bitcoin could go in the next few years:
Hal Finney price forecast: 1BTC = $10million
One of the most important people involved in the early days of Bitcoin, Hal Finney was the first-ever recipient of bitcoin, receiving 10BTC from Satoshi Nakamoto. In what he described as “an amusing thought experiment” he estimated that if Bitcoin became legal tender and the dominant world payment system, each bitcoin would be worth $10 million.
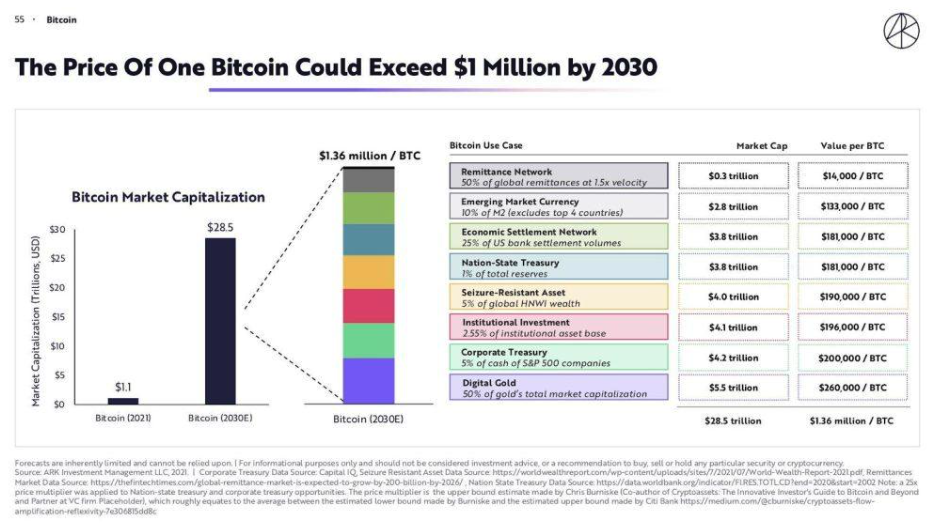
ARK Invest price forecast: 1BTC = $1million by 2030
Cathie Wood’s investment fund is famous for being early in large technology trends, investing in high growth businesses such as Tesla, as well as being early in the trend among institutions to buy bitcoin. Each year ARK Invest publishes a report on key emerging trends.
In their 2021 report, they forecasted that Bitcoin could exceed $1million by the year 2030.
Plan B Stock To Flow = $200,000 by 2025
The author of the Stock to model remains confident that $BTC price will continue to trend upwards over the coming years. His stock to flow model continues to point at an acceleration of price in 2024 taking Bitcoin beyond $200,000
Bitcoin Price Prediction Chart
So that you can make your own decision about Bitcoin price forecasts, we are sharing the Bitcoin price forecast chart above. It uses a selection of blockchain tools to identify how high or how low Bitcoin could go.
You can see that these tools have been accurate in previous cycles, so the latest data for each of them may give us clues as to how far Bitcoin prices may drop, and how high they may climb.
On the chart, we show you various long-term bitcoin price prediction models which forecast the expected price of bitcoin in the future. Some try to identify the lowest price Bitcoin will be in the future, others try to calculate the all-time-high price Bitcoin will reach.
They all go beyond short-term technical analysis to show where bitcoin btc could go next in its market cycle. Just hover over the lines on the chart to see their $BTCUSD target values.
Below, we explain each of the bitcoin price forecast tools, how they are calculated, and who originally created them.
We hope you find this data useful as it provides a unique and more robust way to see Bitcoin price predictions over time. This data updates daily so you can check back in to see how these Bitcoin price forecast models change over time for the peer-to-peer digital asset.
Indicators Overview
Most of these tools use fundamental data taken from the blockchain. The benefit of this is that it uses the actual behavior of market participants. This is arguably better than people attempting to make forecasts simply off news events such as central banks like the federal reserve changing interest rates at certain moments in time, or fluctuations in the cryptocurrency market.
Therefore, we believe that they can be a more effective type of Bitcoin price prediction.
Delta Top
This indicator uses a combination of on-chain and technical inputs.
First, we need to calculate Delta Cap:
Delta Cap = Realized Cap - Average Cap
Realized Cap is explained on this page that shows MVRV Z-Score, so you can go there to learn about how it is calculated. It is essentially the cost-basis paid for all bitcoins.
Average Cap is explained in the Top Cap section below.
Once Delta Cap is calculated, its values over time are then multiplied by 7. The result is Delta Top.
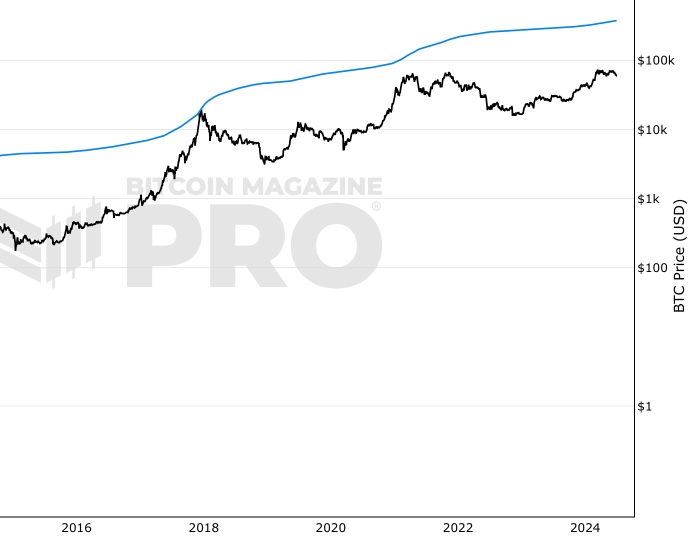
Top Cap
This indicator uses market cap and price information as inputs. It is therefore not an on-chain indicator, unlike many of the other indicators on this page.
To calculate Top Cap, it is first necessary to calculate Average Cap, which is the cumulative sum of Market Cap divided by the age of the market in days. This creates a constant time-based moving average of market cap.
Once Average cap is calculated, those values are multiplied by 35. The result is Top Cap.
For much of Bitcoin’s history, Top Cap has correctly predicted the Bitcoin price high’s of the major cycles where price has gone parabolic due to market euphoria and FOMO (fear of missing out).
Top Cap was created by @woonomic.
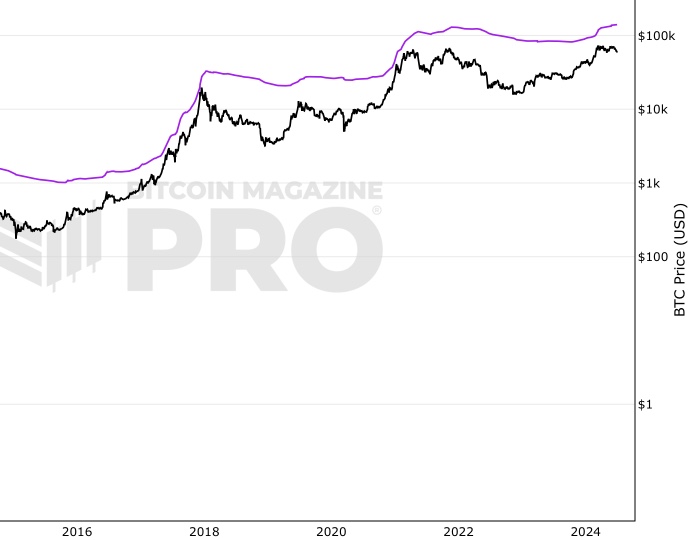
Terminal Price
This is an on-chain indicator. That means it uses data from the Bitcoin blockchain to identify actual user behavior and activity.
Before Terminal price is calculated, it is first necessary to calculate Transferred Price. Transferred price takes the sum of Coin Days Destroyed and divides it by the existing supply of bitcoin and the time it has been in circulation. The value of Transferred Price is then multiplied by 21. Remember that there can only ever be 21 million bitcoin mined.
This creates a 'terminal' value as the supply is all mined, a kind of reverse supply adjustment. Instead of heavily weighting later behavior, it normalizes historical behavior to today. By normalizing by 21, a terminal value is created.
This Terminal Price has historically been very effective at forecasting the tops of Bitcoin price cycles. Terminal Price was created by @_checkmatey_.
Balanced Price
This is an on-chain indicator used for Bitcoin price prediction at the bear market lows. This means that it is trying to identify the lowest price that Bitcoin may drop to in the future.
It uses inputs that we have already explained in the sections above.
It is calculated by subtracting Transferred Price from Realized Price.
Balanced price was created by David Puell.
CVDD
CVDD stands for Cumulative Value Coin Days Destroyed.
Coin Days Destroyed is a term used for bitcoin to identify a value of sorts to UTXO’s (unspent transaction outputs). You can learn more about UTXO’s here. They can be thought of as coins moving between wallets.
When coins are sent between wallets, the transaction has:
- a USD value
- plus, it also destroys a time value in terms of how long the original investor held their coins
That value is Coin Days Destroyed (CDD).
CVDD tracks the cumulative sum of this value-time destruction as coins move from old hands into new hands as a ratio of the market age. It is then multiplied by 6 million, which is a somewhat arbitrary number as it is not linked to any relevant Bitcoin data.
The result is that it has historically correctly forecasted the major lows of Bitcoins price with good accuracy.
CVDD was created by @woonomic.
You May Also Be Interested In
Top Cap
Pricing model for identifying Bitcoin bull market highs.
Delta Top
Pricing model for identifying Bitcoin bull market highs.
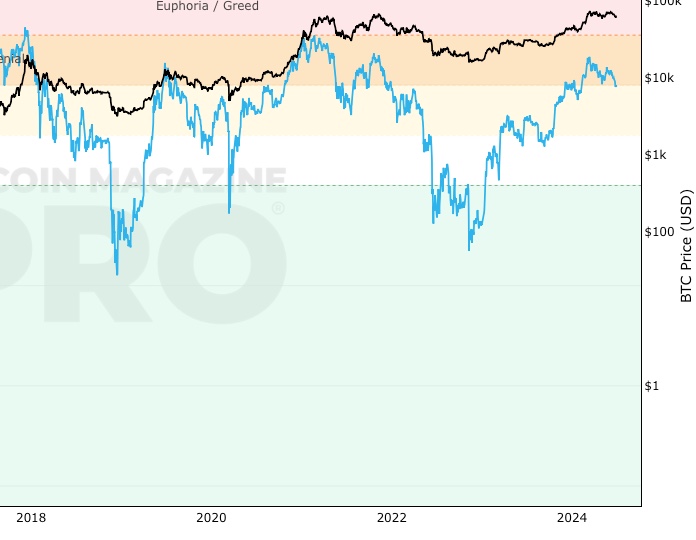
Net Unrealized Profit/Loss (NUPL)
On-chain indicator for investor sentiment market stages
Make smarter decisions about Bitcoin. Instantly.
Access the Bitcoin and Global Macro Charts that really drive Bitcoin’s price.
+40 chart alerts. Never miss critical levels on charts again.
Analysis newsletter. Manage your emotions at market extremes.
Private Tradingview indicators. See Bitcoin chart levels in real time!
Cancel anytime.
Any information on this site is not to be considered as financial advice. Please review the Disclaimer section for more information.