
 Bitcoin: Net Unrealized Profit/Loss (NUPL)
Zoom in with touchscreen: Touch and hold with ONE finger then drag.
Zoom in on desktop: Left click and drag.
Reset: Double click.
Indicator Overview
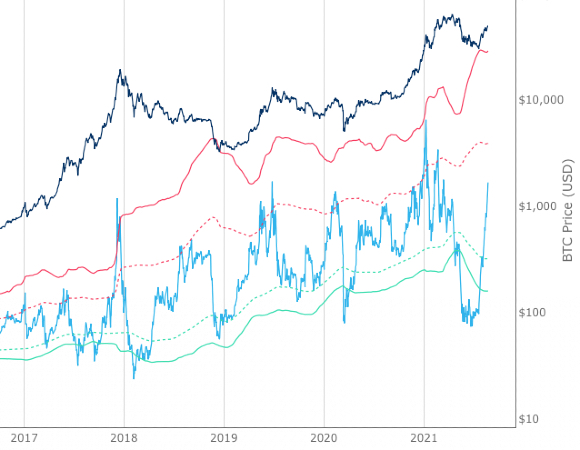
This indicator is derived from Market Value and Realized Value, which can be defined as:
Market Value: The current price of Bitcoin multiplied by the number of coins in circulation. This is like market cap in traditional markets i.e. share price multiplied by number of shares.
Realized Value: Rather than taking the current price of Bitcoin, Realized Value takes the price of each Bitcoin when it was last moved i.e. the last time it was sent from one wallet to another wallet. It then adds up all those individual prices and takes an average of them. It then multiplies that average price by the total number of coins in circulation.By subtracting Realized Value from Market Value we calculate Unrealized Profit/Loss.
Unrealized Profit/Loss estimates the total paper profits/losses in Bitcoin held by investors. This is interesting to know but of greater value is identifying how this changes relatively over time.
To do this we can divide Unrealized Profit/Loss by Market Cap. This creates Net Unrealized Profit/Loss, sometimes referred to as NUPL, which is very useful to track investor sentiment over time for Bitcoin.
Relative Unrealised Profit/Loss is another name used for this analysis.
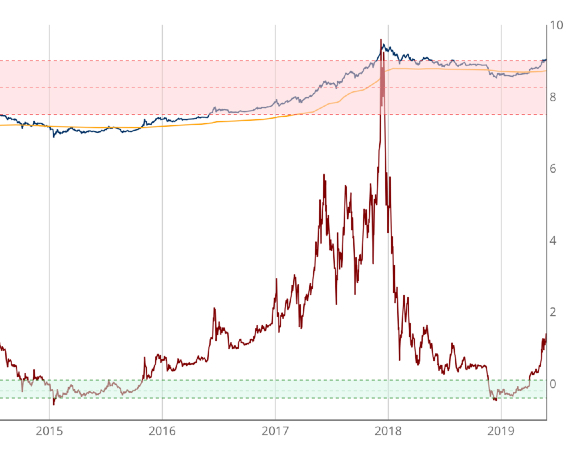
How To View The Chart
The key principle of this tool is in the ratio between market cap and Bitcoin investors taking profit.
When market cap rises much faster than profit taking we see that the market is overheating, one could say due to investor greed (red band). For the strategic investor such times have historically been favourable to take profit.
We can break down different percentages of Bitcoin Relative Unrealized Profit/Loss to determine what stage of the market we are in. This can be advantageous for the long term strategic investor.
Bitcoin Price Prediction Using This Tool
Net Unrealised Profit/Loss (NUPL) is able to use market participant data to help predict Bitcoin price reaching major highs or lows. It uses on-chain data to demonstrate potential market participant emotions at a given moment in time which can be useful for forecasting Bitcoin price and where it may move next over time.
Created By
Tamas Blummer, Tuur Demeester and Michiel Lescrauwaet
Date Created
February 2019
Fall Further Down The Rabbit Hole
Here is the original publication by the team at Adamant Capital: A primer on bitcoin investor sentiment and changes in saving behaviour
Similar Live Charts That You May Find Useful
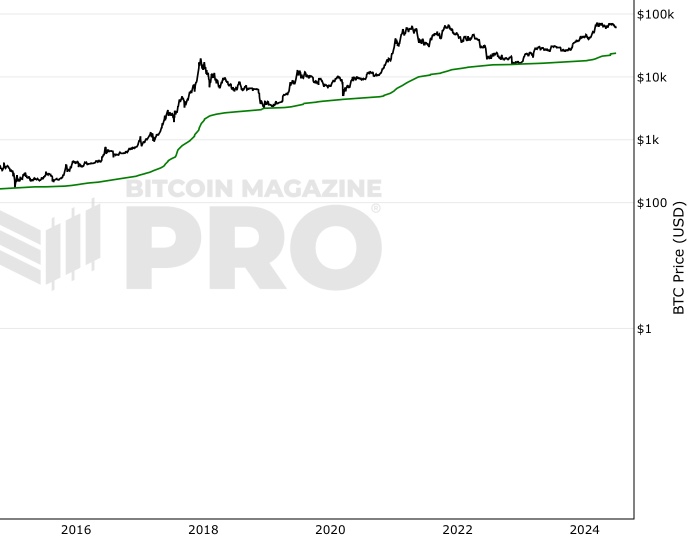
Another live chart that uses Realised value data is MVRV Z-Score.
Video Explainer
You May Also Be Interested In
Advanced NVT Signal
This adaptation of NVT Signal adds standard deviation bands to identify when Bitcoin is overbought or oversold.
MVRV Z-Score
Pulls apart differences between Market Value and Realised Value to identify market cycle highs and lows.
CVDD
Pricing model for identifying Bitcoin bear market lows.
Make smarter decisions about Bitcoin. Instantly.
Access the Bitcoin and Global Macro Charts that really drive Bitcoin’s price.
+40 chart alerts. Never miss critical levels on charts again.
Analysis newsletter. Manage your emotions at market extremes.
Private Tradingview indicators. See Bitcoin chart levels in real time!
Cancel anytime.
Any information on this site is not to be considered as financial advice. Please review the Disclaimer section for more information.