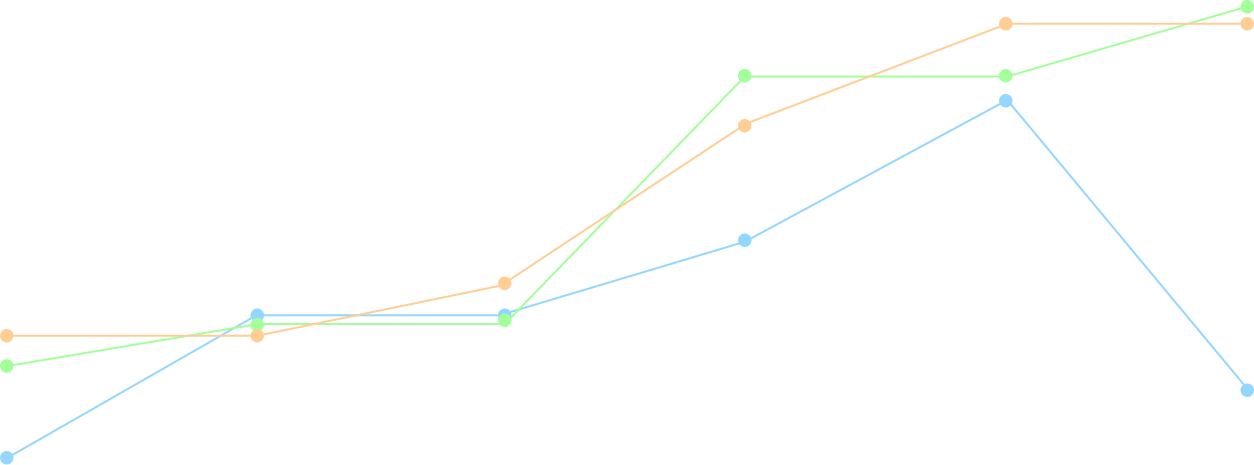
Relying On Confluence
Individual metrics like the MVRV Z-Score, Global M2 data, Active Address Sentiment Indicator, or the Stock-to-Flow Model offer unique yet valuable insights into market behavior. However, they can each have limitations, potentially leading to biased interpretations if relied on in isolation. By integrating these metrics, we can mitigate individual biases and outliers.

Looking for confluence from not just one data source but all sources of influence on the BTC price using something such as the above Bitcoin Trajectory Catalysts as inspiration, the result is a robust and reliable metric that clearly indicates whether Bitcoin is in an uptrend, downtrend, or period of consolidation that is not overly influenced from a sudden change in conditions that may only impact a small number of metrics.
A *Somewhat* Non-Overfitted Solution
The beauty of this approach lies in its non-overfitted nature. Unlike models that are fine-tuned to fit specific data sets, this model equally weights all components to prevent overreliance on a few small parts that have historically performed well.
...