
 Bitcoin: The Puell Multiple
Zoom in with touchscreen: Touch and hold with ONE finger then drag.
Zoom in on desktop: Left click and drag.
Reset: Double click.
Indicator Overview
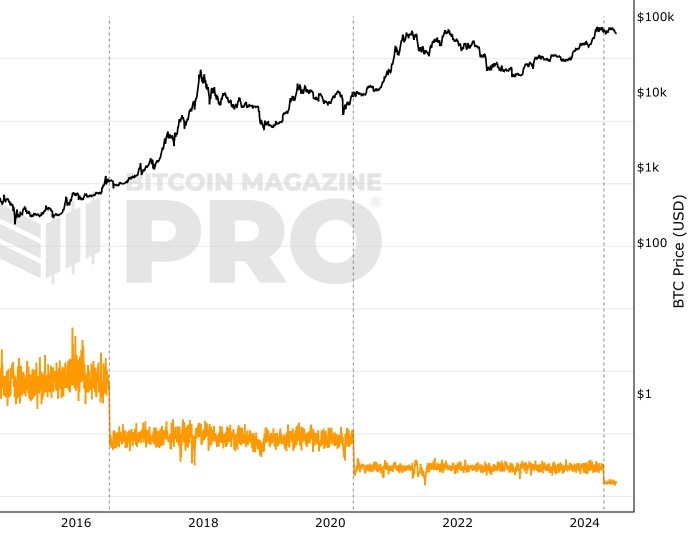
This metric looks at the supply side of Bitcoin's economy - bitcoin miners and their revenue.It explores market cycles from a mining revenue perspective. Bitcoin miners are sometimes referred to as compulsory sellers due to their need to cover fixed costs of mining hardware in a market where price is extremely volatile. The revenue they generate can therefore influence price over time.
The Puell Multiple is calculated by dividing the daily issuance value of bitcoins (in USD) by the 365-day moving average of daily issuance value.
How It Can Be Used
There are periods of time where the value of bitcoins being mined and entering the ecosystem is too great or too little relative to historical norms.Understanding these periods of time can be beneficial to the strategic Bitcoin investor.
The chart above highlights periods where the value of Bitcoin's issued on a daily basis has historically been extremely low (Puell Multiple entering green box), which produced outsized returns for Bitcoin investors who bought Bitcoin here. It also shows periods where the daily issuance value was extremely high (Puell Multiple entering red box), providing advantageous profit-taking for Bitcoin investors who sold here.
Bitcoin Price Prediction Using This Tool
The Puell Multiple uses the upper red band on the chart to show when miner revenues in USD terms are significantly higher than historical norms (in this case the 365-day moving average). Over the majority of Bitcoins’ existence, these periods have been when the price of $BTC has also reached its major highs. So the Puell Multiple can be a useful Bitcoin forecasting tool to identify based on this metric whether price is too high and needs to drop (when the indicator is in the red zone), or whether it is too low and may need to bounce (indicator is in the green zone).
Created By
David PuellDate Created
March 2019
Fall Further Down The Rabbit Hole
You can learn more about the Puell Multiple in this article written by @cryptopoiesis. Medium article: The Puell Multiple
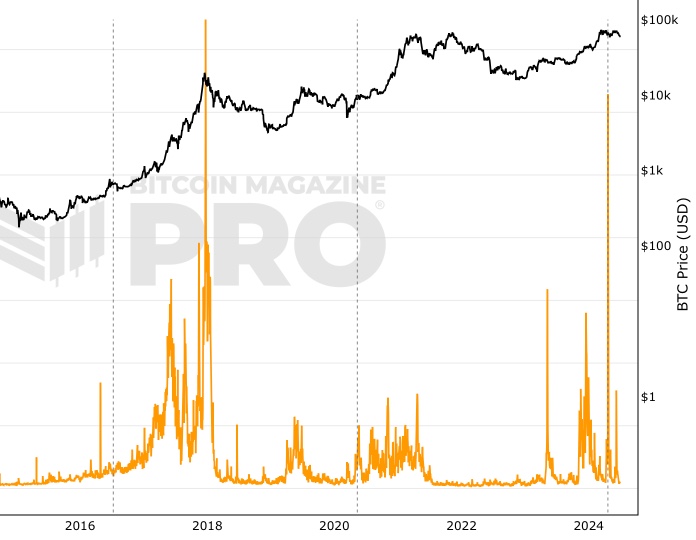
Similar Live Charts That You May Find Useful
The Puell Multiple is able to identify when the price of Bitcoin is unsustainably high or low by using the upper red band and the lower green band. Charts on this site that use a similar approach include MVRV Z-Score, RHODL Ratio and Reserve Risk.
You May Also Be Interested In

Hash Ribbons Indicator
Hash Ribbons Indicator: Highlights miner capitulation to identify major price lows.
Miner Revenue (Block Rewards)
Bitcoin miner revenues earned from block rewards.
Miner Revenue (Fees)
Bitcoin miner revenues earned from fees.
Make smarter decisions about Bitcoin. Instantly.
Access the Bitcoin and Global Macro Charts that really drive Bitcoin’s price.
+40 chart alerts. Never miss critical levels on charts again.
Analysis newsletter. Manage your emotions at market extremes.
Private Tradingview indicators. See Bitcoin chart levels in real time!
Cancel anytime.
Any information on this site is not to be considered as financial advice. Please review the Disclaimer section for more information.