
 Bitcoin: MVRV Z-Score
Zoom in with touchscreen: Touch and hold with ONE finger then drag.
Zoom in on desktop: Left click and drag.
Reset: Double click.
Indicator Overview
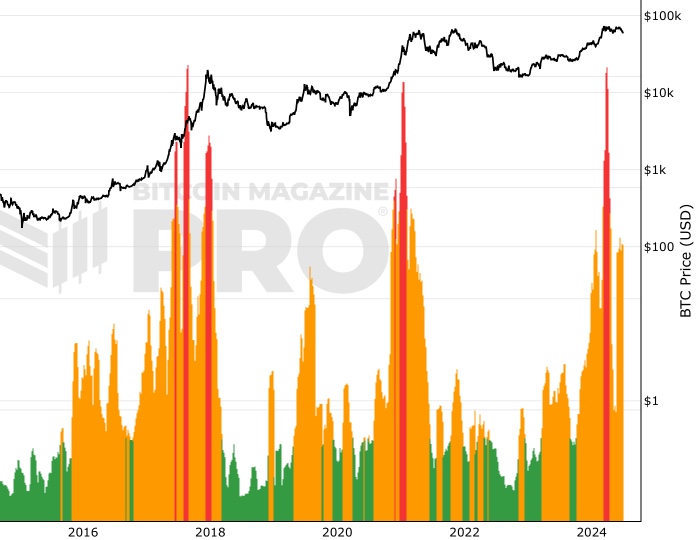
MVRV Z-Score is a bitcoin chart that uses blockchain analysis to identify periods where Bitcoin is extremely over or undervalued relative to its 'fair value'.
It uses three metrics:
1. Market Value (black line): The current price of Bitcoin multiplied by the number of coins in circulation. This is like market cap in traditional markets i.e. share price multiplied by number of shares.
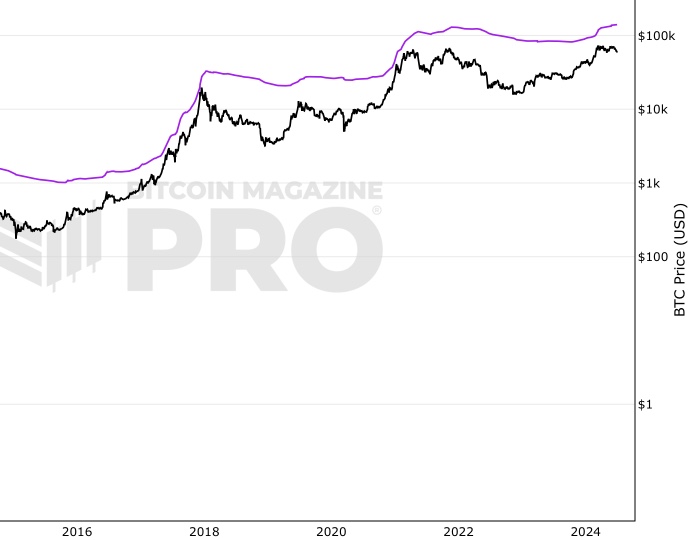
2. Realised Value (blue line): Rather than taking the current price of Bitcoin, Realised Value takes the price of each Bitcoin when it was last moved i.e. the last time it was sent from one wallet to another wallet. It then adds up all those individual prices and takes an average of them. It then multiplies that average price by the total number of coins in circulation.
In doing so, it strips out the short term market sentiment that we have within the Market Value metric. It can therefore be seen as a more 'true' long term measure of Bitcoin value which Market Value moves above and below depending on the market sentiment at the time.
3. Z-score (orange line): A standard deviation test that pulls out the extremes in the data between market value and realised value.
How It Can Be Used
The MVRV Z-score has historically been very effective in identifying periods where market value is moving unusually high above realised value. These periods are highlighted by the z-score (orange line) entering the pink box and indicates the top of market cycles. It has been able to pick the market high of each cycle to within two weeks.
It also shows when market value is far below realised value, highlighted by z-score entering the green box. Buying Bitcoin during these periods has historically produced outsized returns.
Bitcoin Price Prediction Using This Tool
MVRV Z-Score bitcoin chart is useful for predicting Bitcoin price at the extremes of market conditions. It is able to forecast where Bitcoin price may need to pull back when MVRV Z-score enters the upper red band, and also when $BTC price may rally after spending time in the lower green band.
Historically it has picked major Bitcoin price highs to within 2 weeks.
Created By
@aweandwonder who has unfortunately since deleted the original article and his online profile.
He built on the initial work to create MVRV by Murad Mahmudov and David Puell
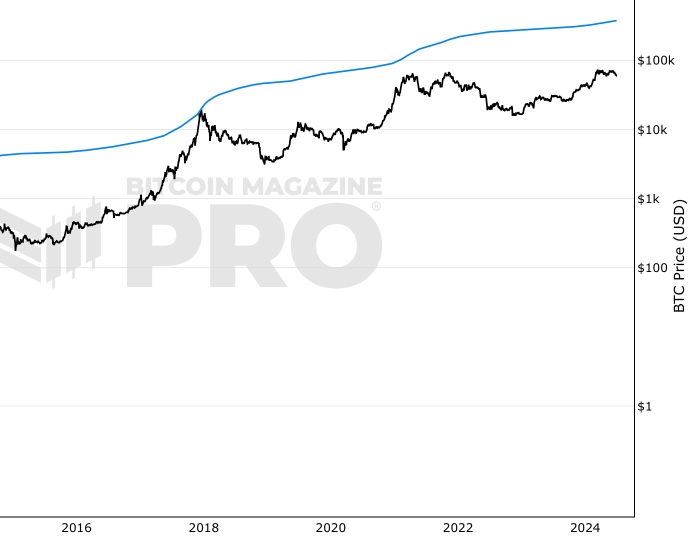
MVRV (Market Value to Realised Value Ratio)
The MVRV ratio bitcoin tool is also shown on the chart above. See the chart key to select MVRV scores which are represented by the black line on the chart.
This metric takes the ratio between market value and realized value and plots that ratio over time. MVRV was created to show periods of market euphoria when the market value was considerably higher than realized value (the cost basis level for bitcoin purchases). While MVRV does show broad trends of where the price is overbought or oversold, it is less effective than MVRV Z-score for specifically identifying market cycle tops and bottoms.
You can view the MVRV metric on the chart above by selecting ‘MVRV’ on the chart key and de-selecting MVRV Z-Score.
Date Created
November 2018
Fall Further Down The Rabbit Hole
Similar Live Charts That You May Find Useful
The MVRV Z-Score live chart is able to identify when the price of Bitcoin is unsustainably high or low by using the upper red band and the lower green band. Charts on this site that use a similar approach include Puell Multiple, RHODL Ratio and Reserve Risk.
Video Explainer
You May Also Be Interested In
Value Days Destroyed (VDD) Multiple
Identifies Bitcoin cycle highs by comparing near-term spending velocity with yearly average of spending velocity.
Delta Top
Pricing model for identifying Bitcoin bull market highs.
Top Cap
Pricing model for identifying Bitcoin bull market highs.
Make smarter decisions about Bitcoin. Instantly.
Access the Bitcoin and Global Macro Charts that really drive Bitcoin’s price.
+40 chart alerts. Never miss critical levels on charts again.
Analysis newsletter. Manage your emotions at market extremes.
Private Tradingview indicators. See Bitcoin chart levels in real time!
Cancel anytime.
Any information on this site is not to be considered as financial advice. Please review the Disclaimer section for more information.