
 Bitcoin: The Golden Ratio Multiplier
Zoom in with touchscreen: Touch and hold with ONE finger then drag.
Zoom in on desktop: Left click and drag.
Reset: Double click.
Note: Clicking the labels on the key above can turn the chart lines on and off.
Indicator Overview
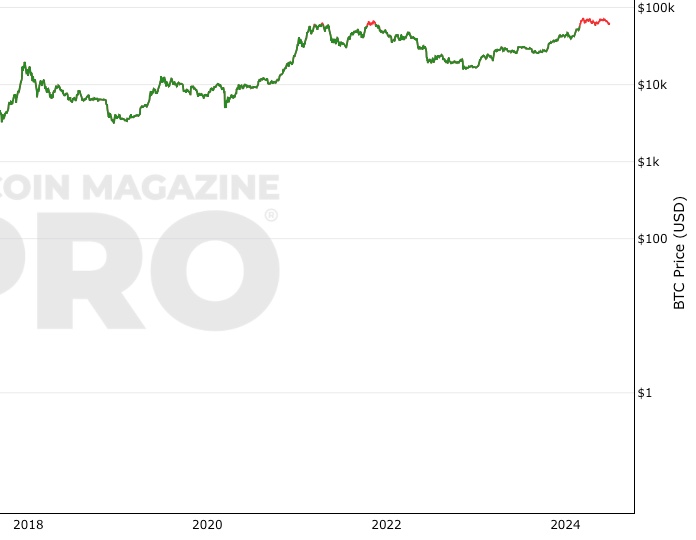
The Golden Ratio Multiplier is a bitcoin chart that explores Bitcoin's adoption curve and market cycles to understand how price may behave on medium to long term time frames.
To do this it uses multiples of the 350 day moving average (350DMA) of Bitcoin's price to identify areas of potential resistance to price movements. Note: multiples are of the 350DMA's price values rather than its number of days.
The multiples reference the Golden Ratio (1.6) and the Fibonacci sequence (0, 1, 1, 2, 3, 5, 8, 13, 21). These are important mathematical numbers.
These specific multiplications of the 350DMA have been very effective over time at picking out intracycle highs for Bitcoin price and also the major market cycle highs.
As Bitcoin becomes adopted over time, it's market cycle highs hit decreasing Fibonacci sequence multiples of the 350DMA. This is because the explosive growth of Bitcoin on a logarithmic scale is slowing over time. As it's market cap increases it becomes more difficult for the same log scale growth rates to continue.
If this decreasing Fibonacci sequence pattern continues to play out as it has done over the course of the past 9 years, then the next market cycle high will be when price is in the area of the 350DMA x3.
The Golden Ratio Multiplier is an effective tool because it is able to demonstrate when the market is likely overstretched within the context of Bitcoin's adoption curve growth and market cycles. For more information on the indicator see the link below.
Will It Work Beyond Adoption?
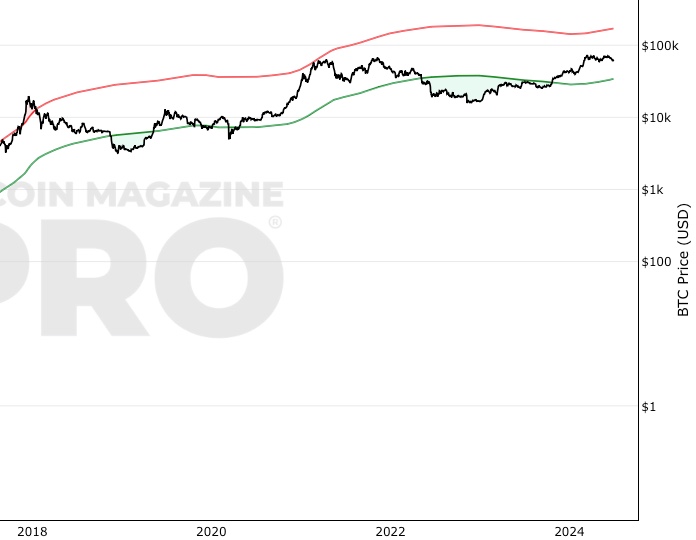
This indicator, along with the Pi Cycle Top indicator was designed to work in Bitcoin’s early adoption phase before it reaches mainstream status. That adoption phase can be seen on the price chart with the broad arc shape of price growth overtime on the logarithmic scale. Having tapped the higher fib level multiples, we believe the final significant fib level to tap while in the adoption phase is the x2 multiple (red line). Beyond that point, Bitcoin will have completed its adoption growth according to this indicator, the indicator will have completed its role, and a new growth phase will begin.
Bitcoin Price Prediction Using This Tool
The colored fib levels indicate where there may be major resistance for Bitcoin price when it reaches them. This has been true throughout Bitcoin’s history as $BTC price major highs have descended down the fib multiples. It is therefore a useful Bitcoin price prediction tool, and indicator of where the smart investor may choose to manage their risk. It is currently forecasting that the next potential resistance level is the x2 multiple (red line).
Created By
Date Created
April 2019
Fall Further Down The Rabbit Hole
The Golden Ratio Multiplier Medium Article
Similar Live Charts That You May Find Useful
The Golden Ratio Multiplier was built alongside the Pi Cycle Top Indicator which uses a similar methodology. .
You May Also Be Interested In
Bitcoin Profitable Days
The proportion of days in Bitcoin's traded history that it has been profitable to hold Bitcoin
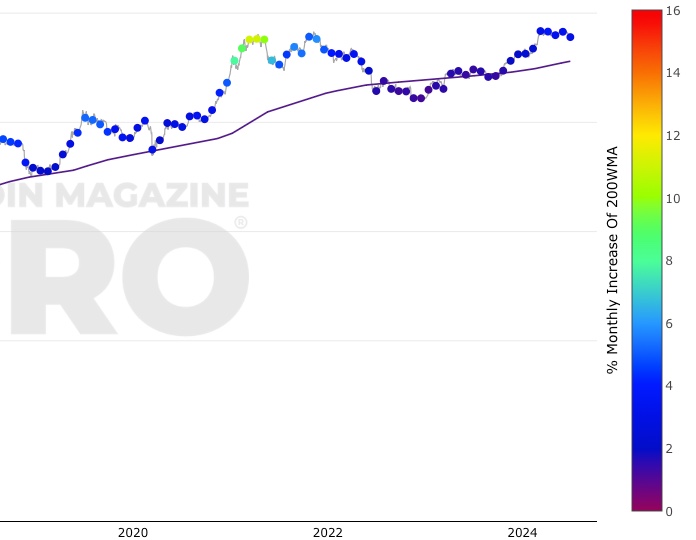
200 Week Moving Average Heatmap
A simple heatmap system based on movements of the 200 week moving average.
Bitcoin Investor Tool: 2-Year MA Multiplier
Long timeframe investor tool to identify under/oversold price periods
Make smarter decisions about Bitcoin. Instantly.
Access the Bitcoin and Global Macro Charts that really drive Bitcoin’s price.
+40 chart alerts. Never miss critical levels on charts again.
Analysis newsletter. Manage your emotions at market extremes.
Private Tradingview indicators. See Bitcoin chart levels in real time!
Cancel anytime.
Any information on this site is not to be considered as financial advice. Please review the Disclaimer section for more information.